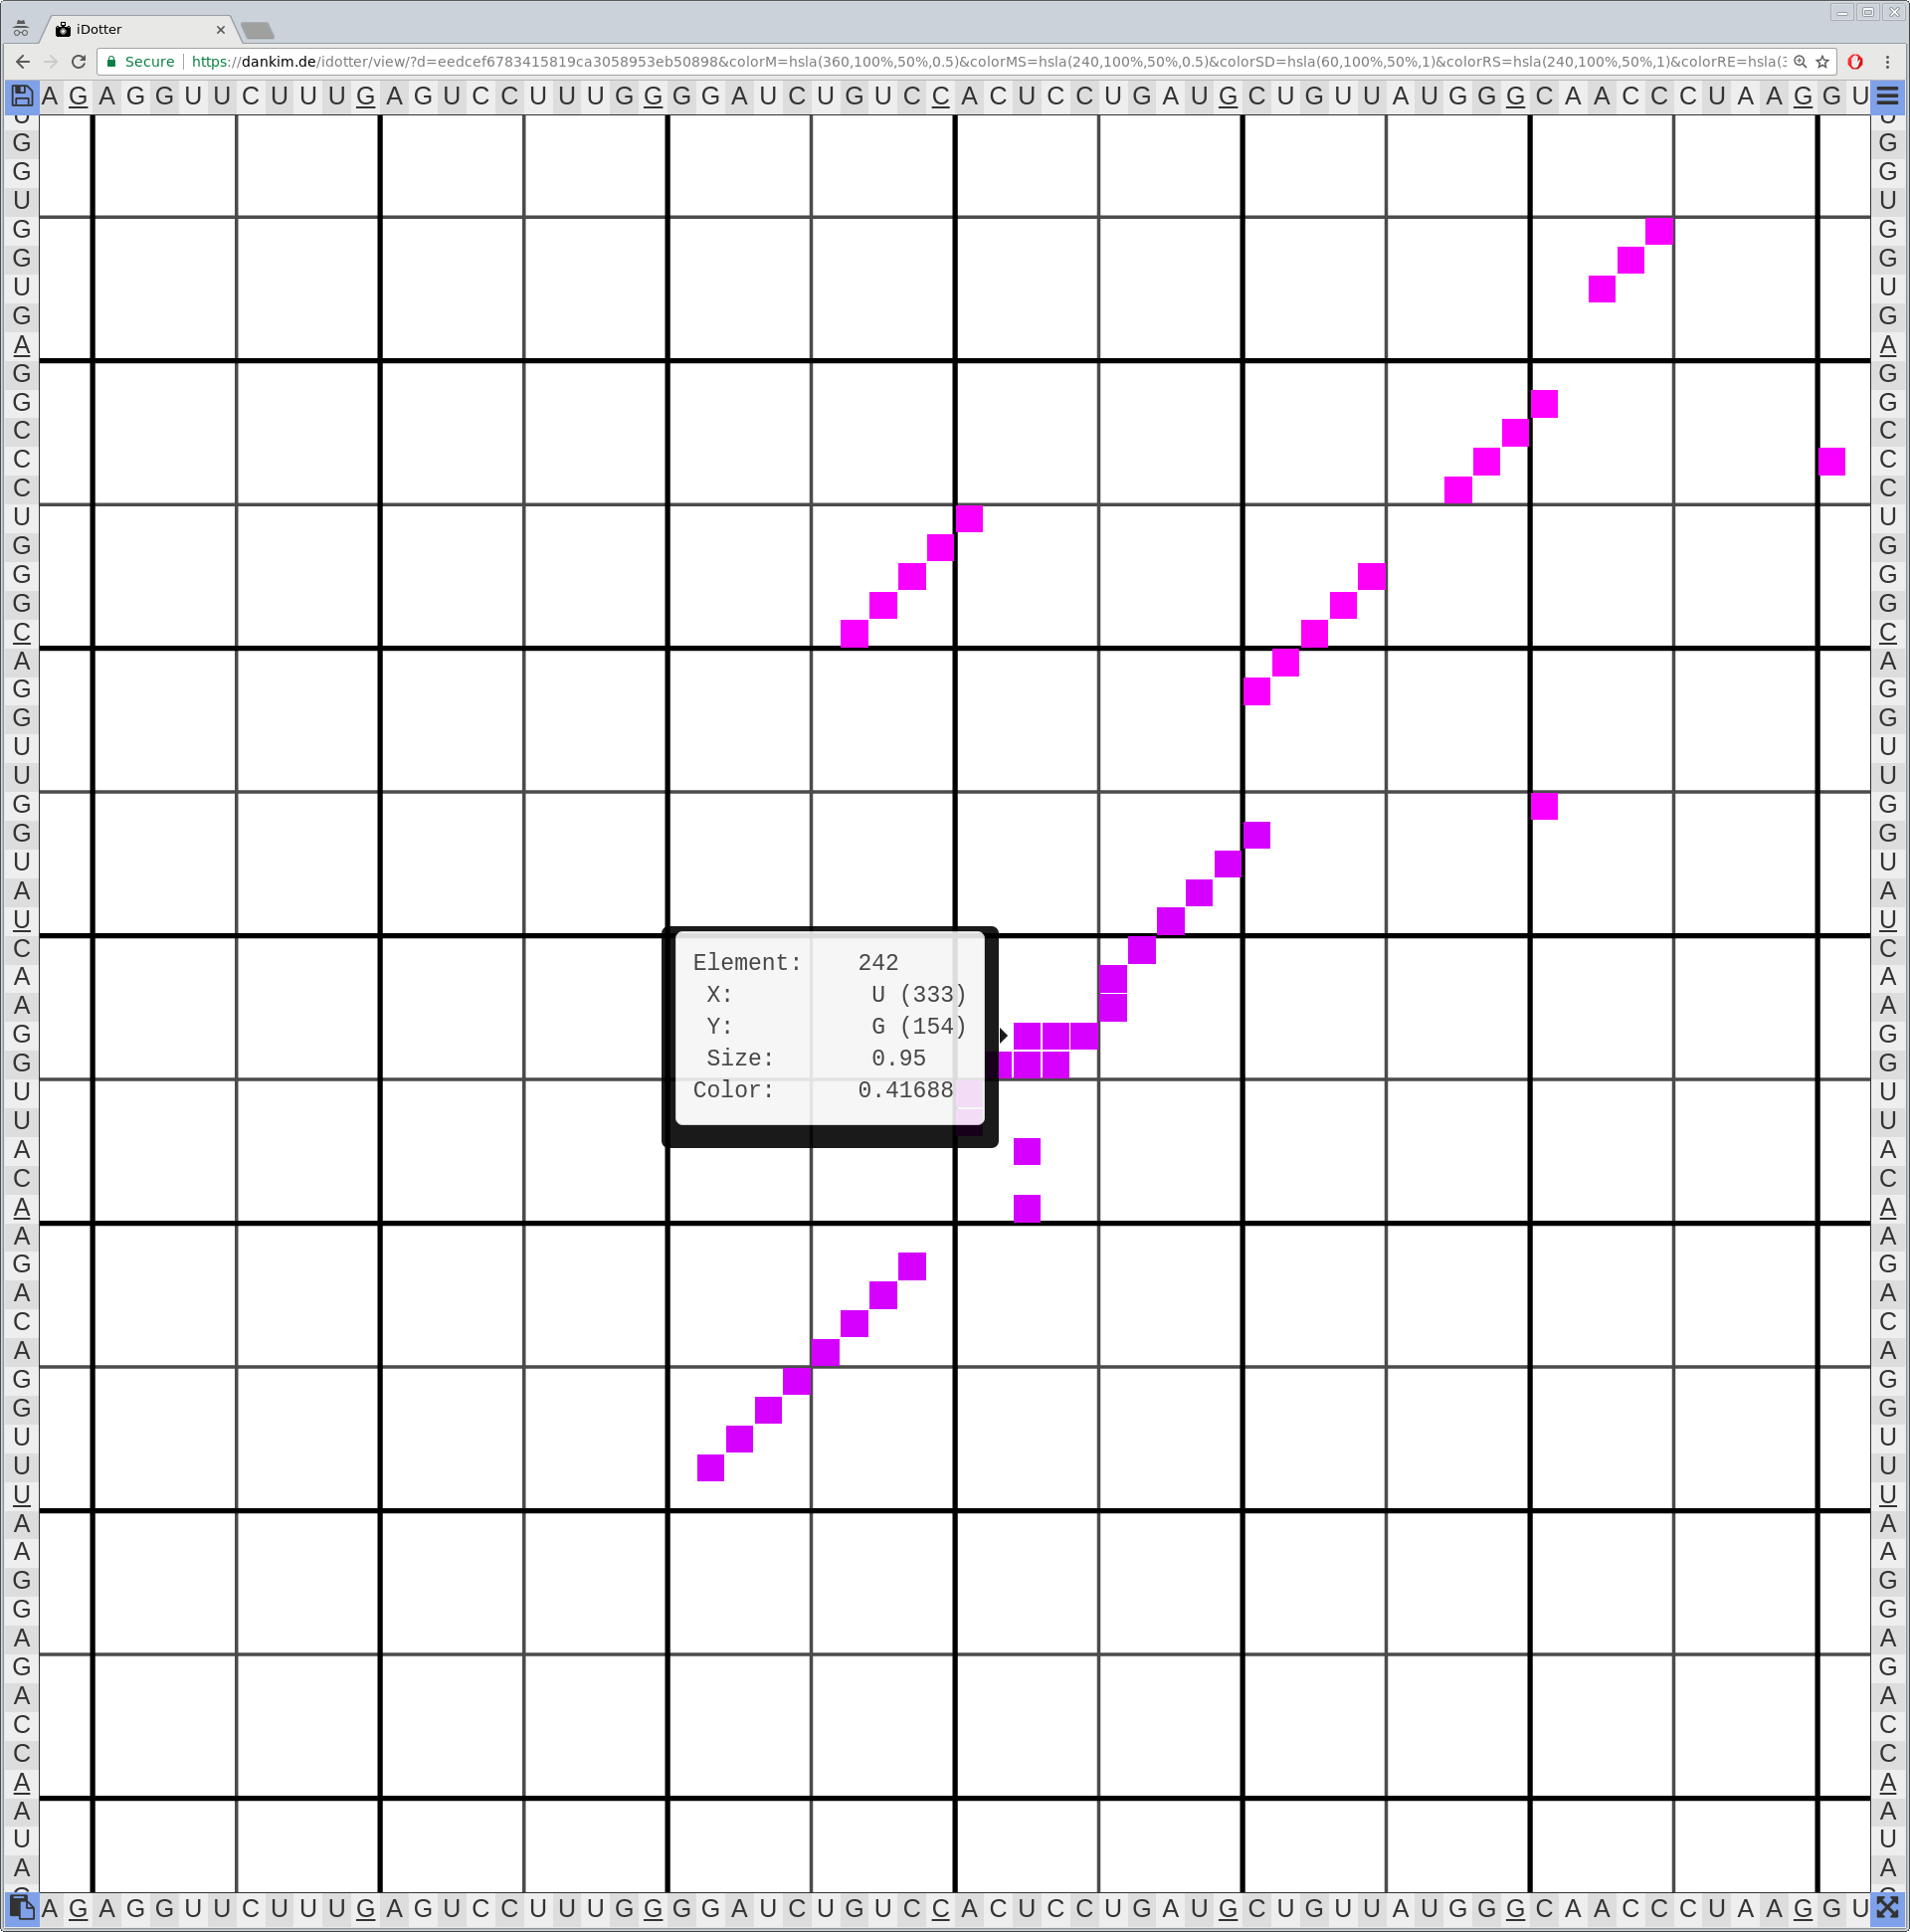
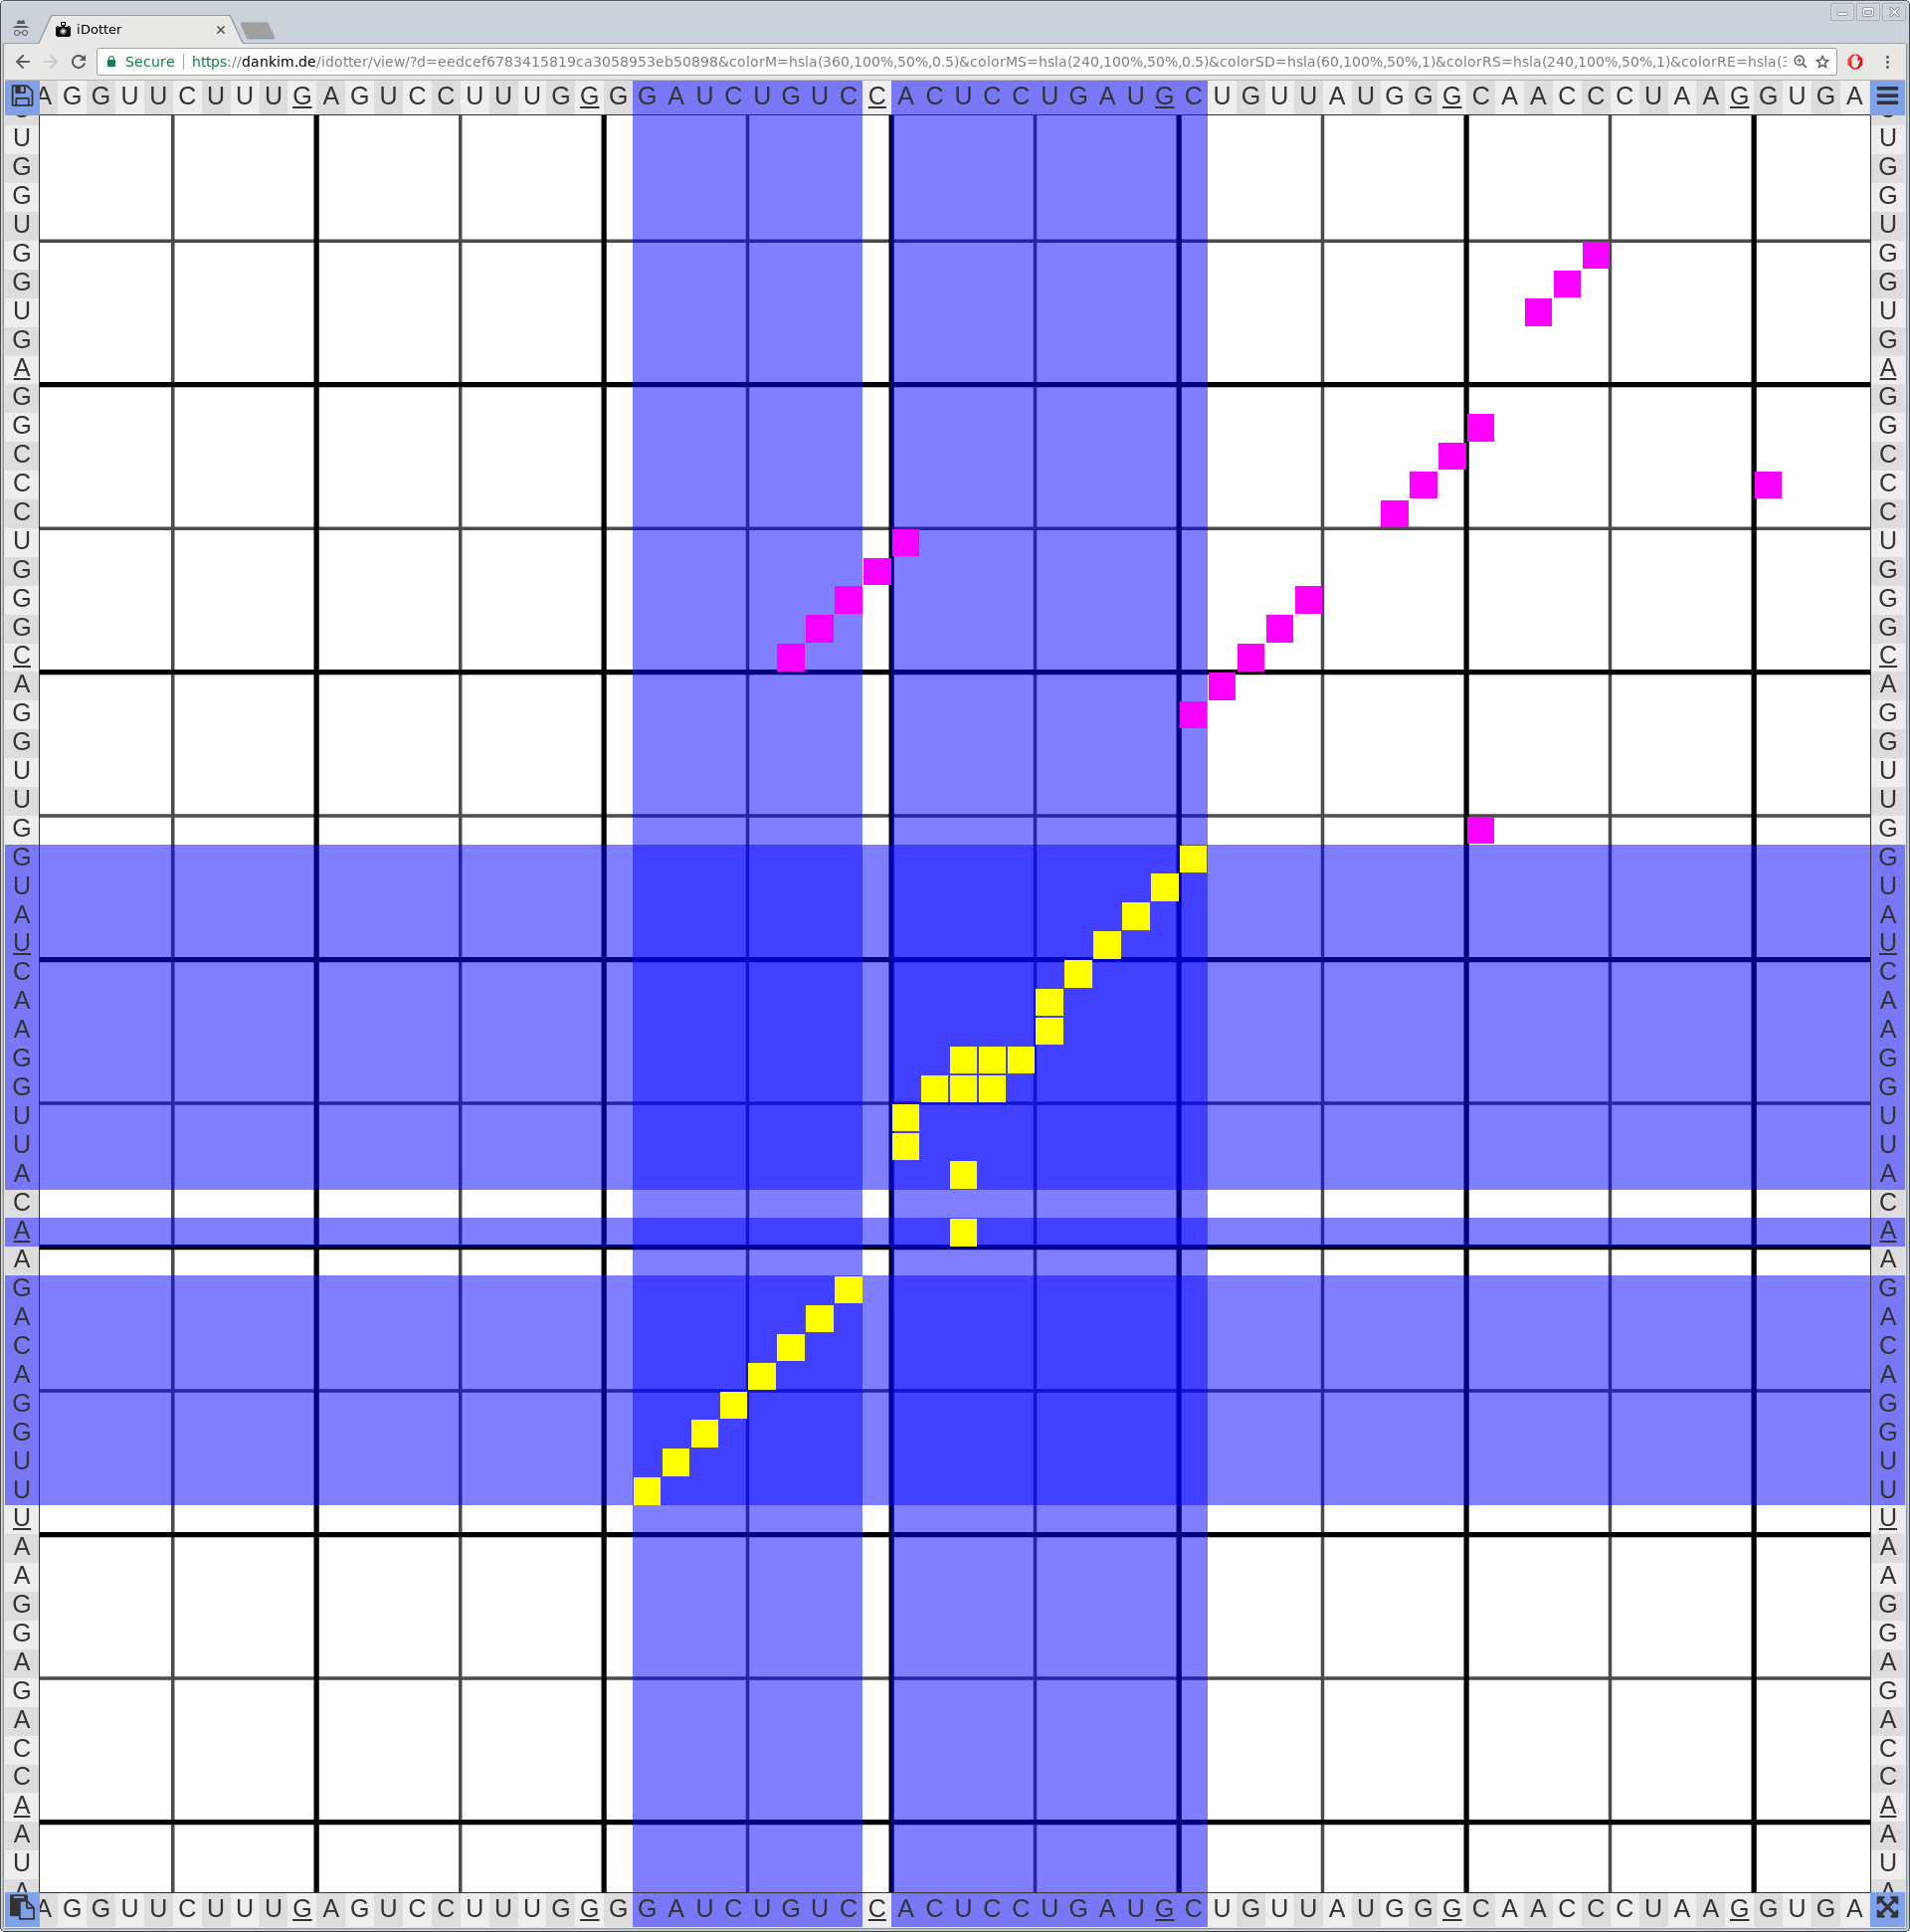
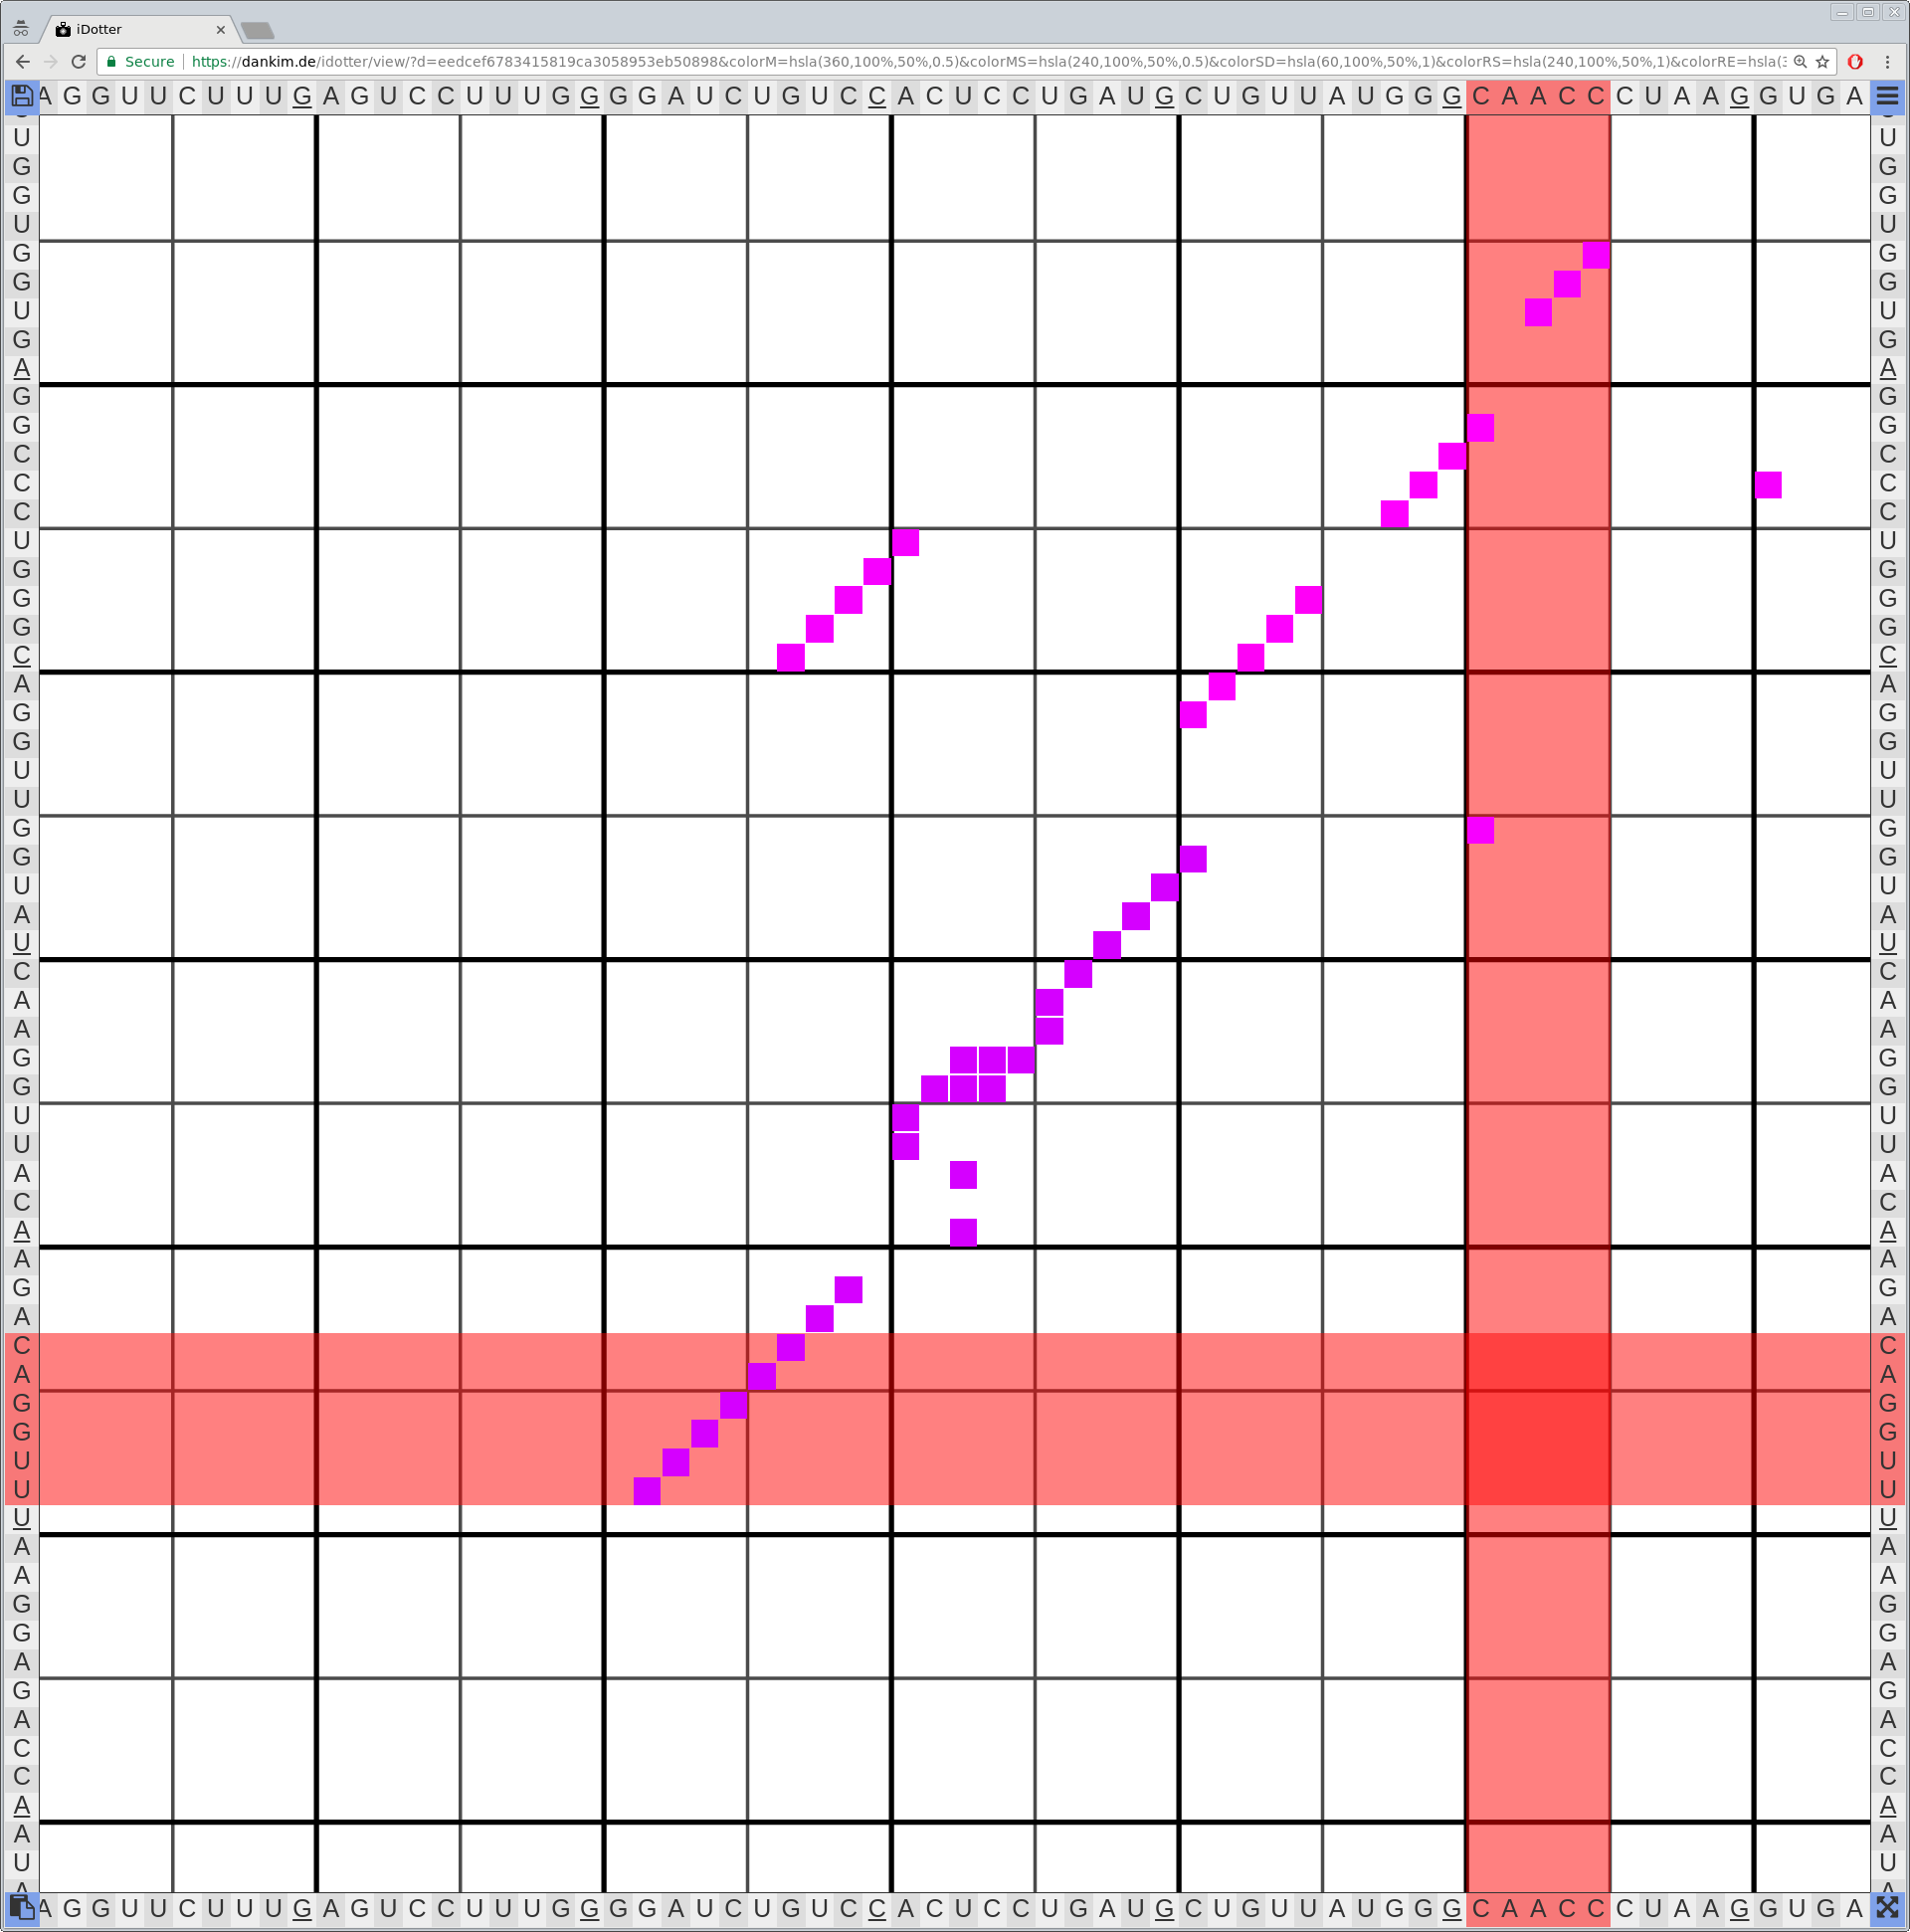
Bioinformaticians judge the likelihood of the overall RNA secondary structure based on comparing its base pair probabilities. These probabilities can be calculated by various tools and are frequently displayed using dot plots for further analysis. However, most tools produce only static dot plot images which restricts possible interactions to the capabilities of the respective viewers (mostly PostScript-viewers). Moreover, this approach does not scale well with larger RNAs since most PostScript viewers are not designed to show a huge number of elements and have only legacy support for PostScript. Therefore, we developed iDotter, an interactive tool for analyzing RNA secondary structures. iDotter overcomes the previously described limitations providing multiple interaction mech- anisms facilitating the interactive analysis of the displayed data. According to the biologists and bioinformaticians that regularly use out interactive dot plot viewer, iDotter is superior to all previous approaches with respect to facilitating dot plot based analysis of RNA secondary structures.
iDotter is available under the GNU GPL v3 on https://git.gurkware.de/biovis/idotter.git
iDotter is hosted at https://idotter.sca-ds.de


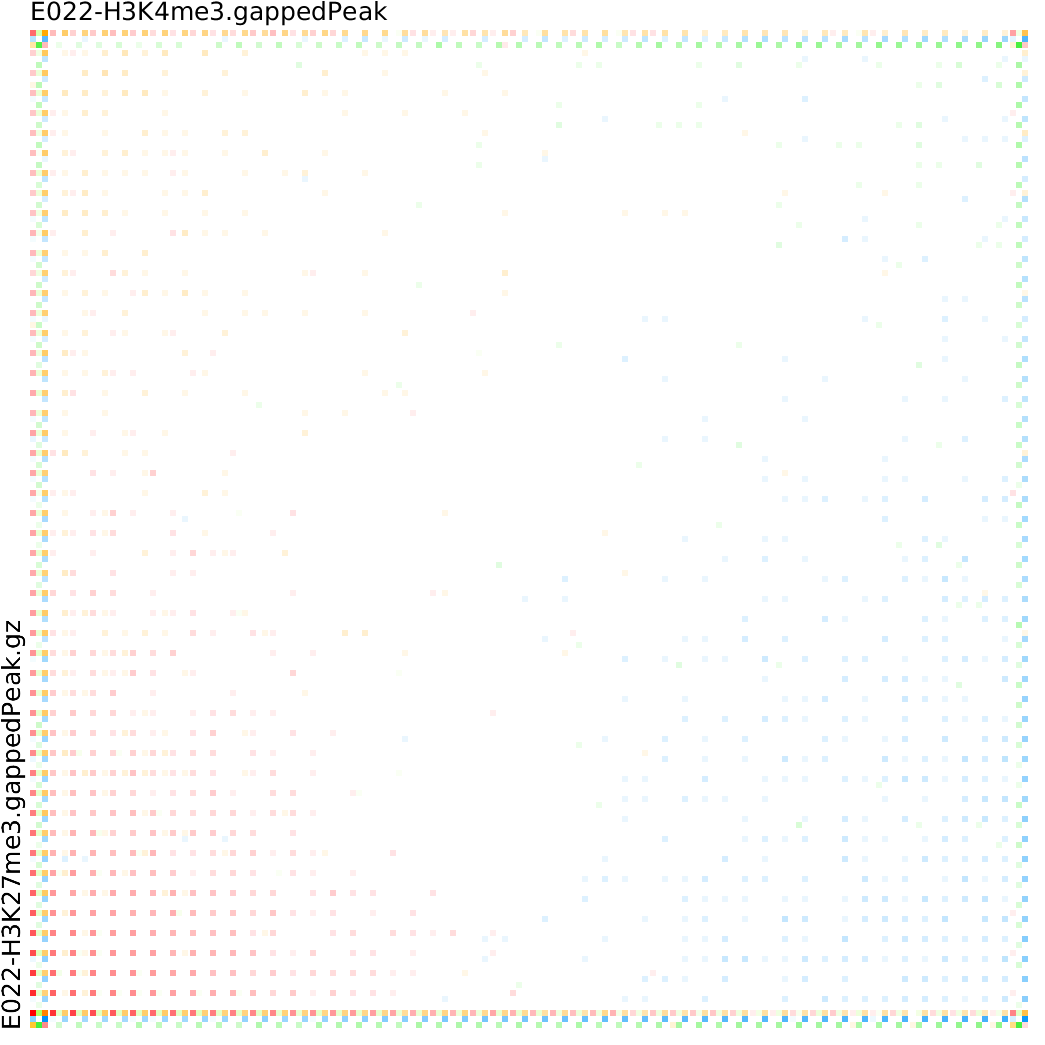
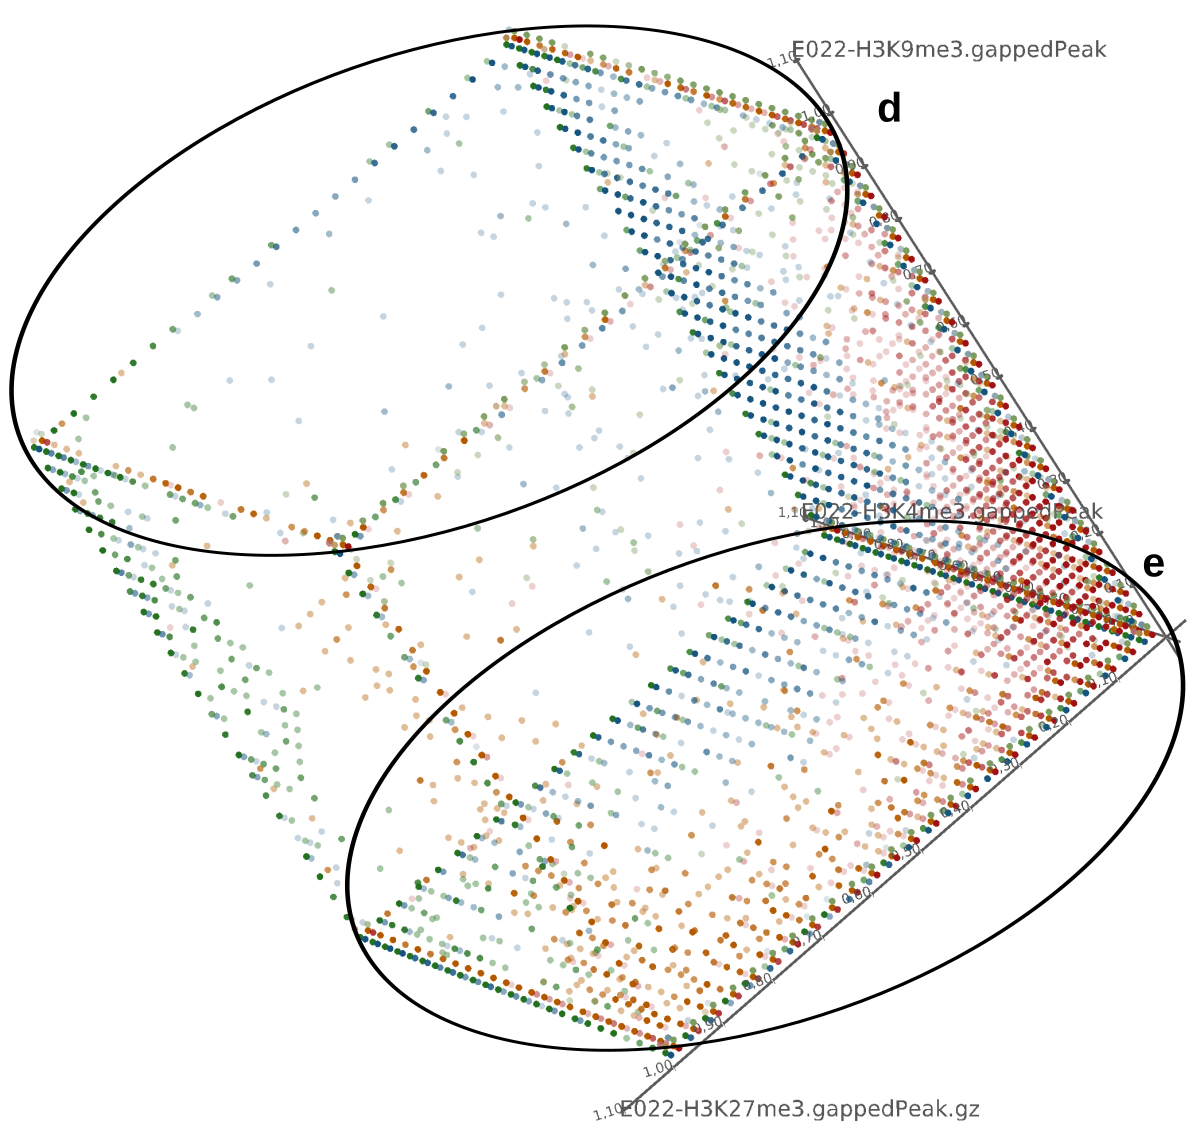
Epigenetics data is very important for understand- ing the differentiation of cells into different cell types. More- over, the amount of epigenetic data available was and still is considerably increasing. To cope with this big amount of data, statistical or visual analysis is used. Usually, biologists analyze epigenetic data using statistical methods like correlations on a high level. However, this does not allow to analyze the fate of histone modifications in detail during cell specification or to compare histone modifications in different cell lines. Tiled binned scatter plot matrices proved to be very useful for this type of analysis showing binary relationships. We adapted the idea of tiling and binning scatter plots from 2D to 3D, such that ternary relationships can be depicted. Comparing tiled binned 3D scatter plots—the new method—to tiled binned 2D scatter plot matrices showed, that many relations that are difficult or impossible to find using tiled binned 2D scatter plot matrices can easily be observed using the new approach. We found that using our approach, changes in the distribution of the marks over time (different cell types) or differences between different replicates of the same cell sample are easy to detect. Tiled binned 3D scatter plots proved superior compared to the previously used method due to the reduced amount of overplotting leading to less interaction necessary for gaining similar insights.
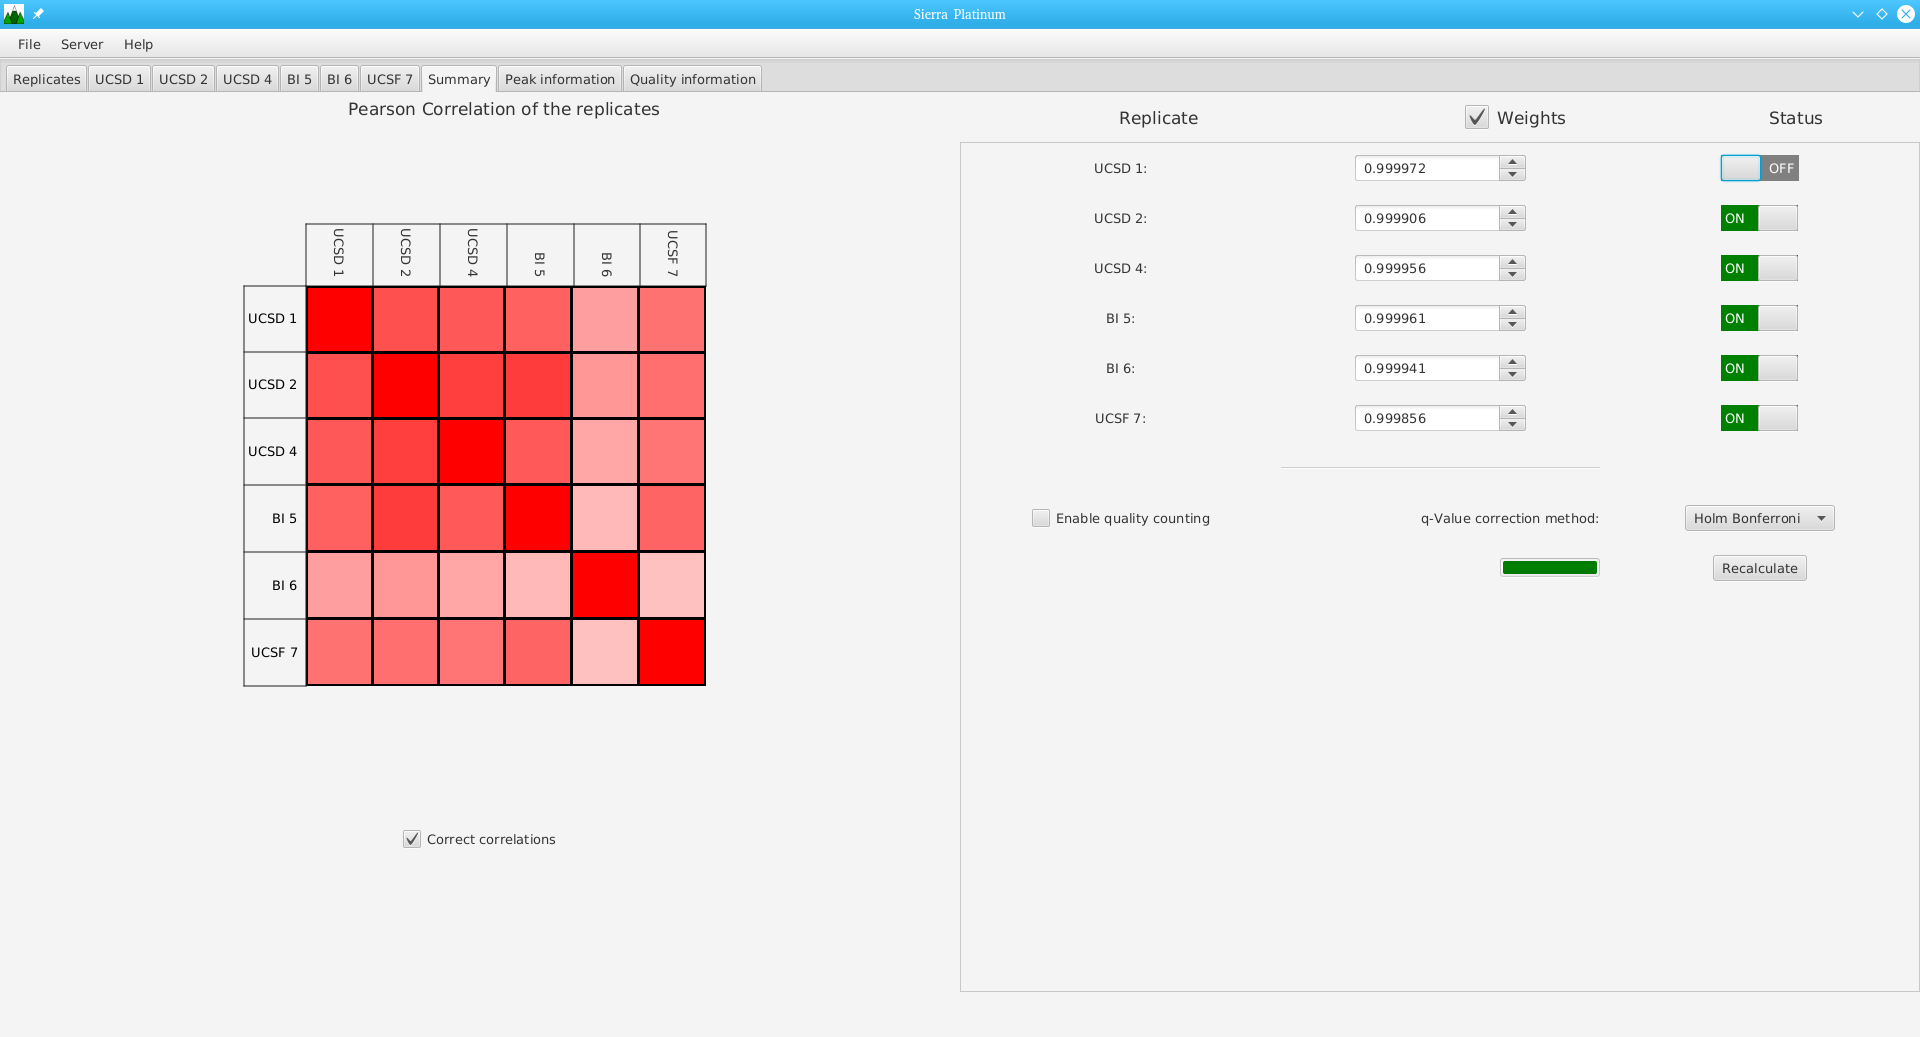
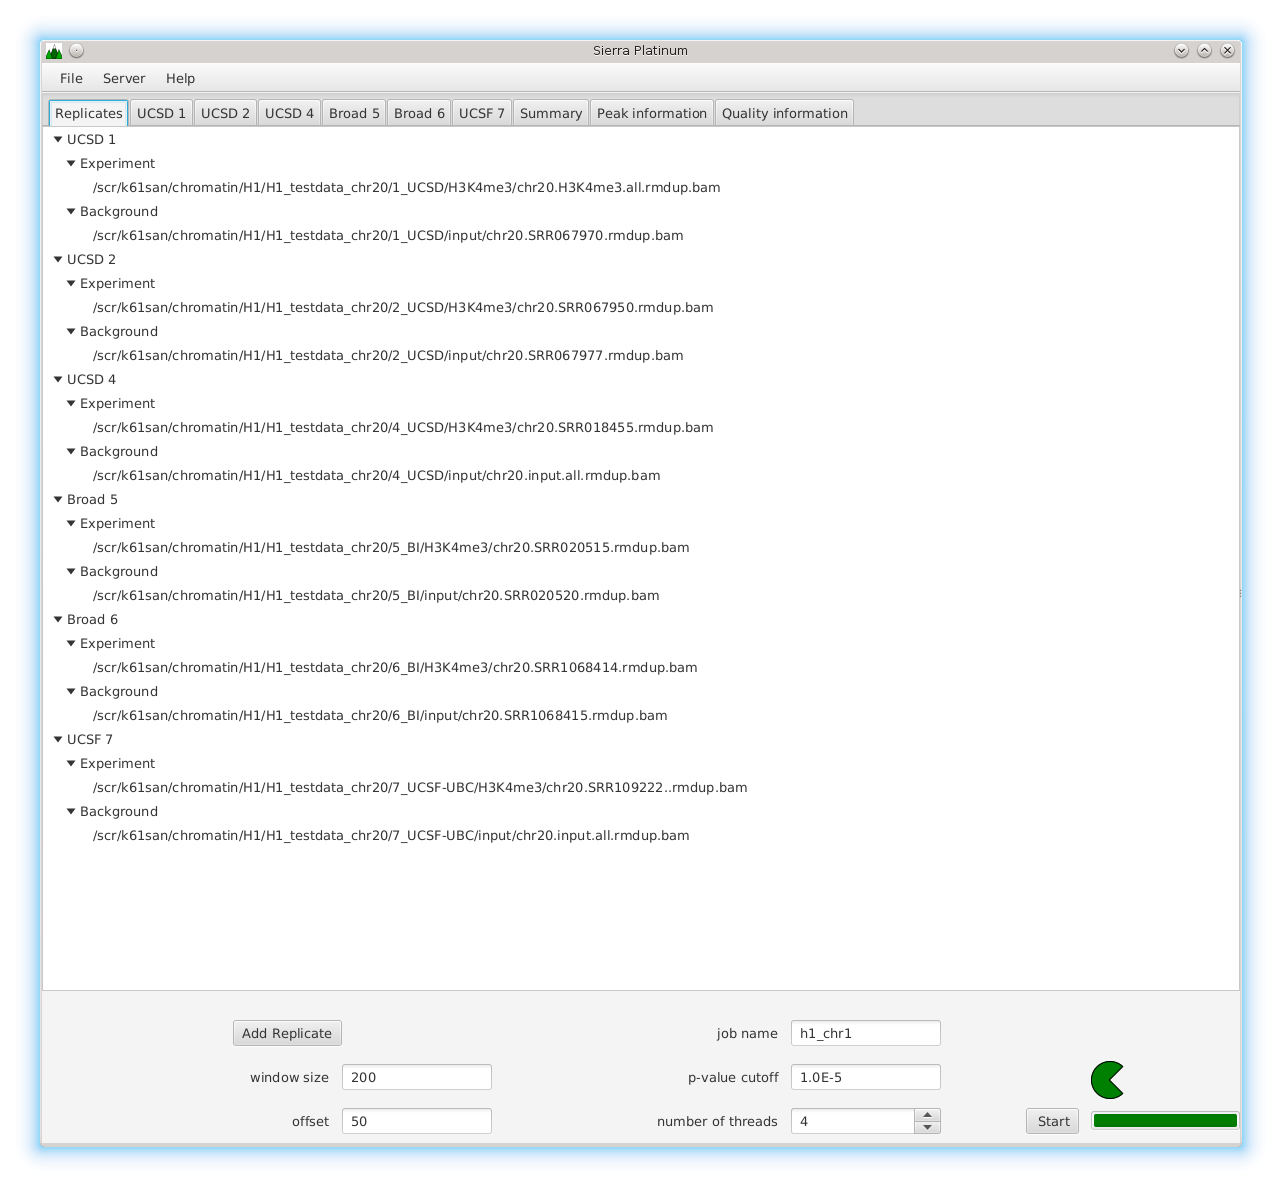
DNA bound proteins such as transcription factors and modified histone proteins play an important role in gene regulation. Therefore, their genomic locations are of great interest. Usually, the location is measured using ChIP-seq and analyzed using a peak-caller. While replicated ChIP-seq experiments become more and more available, they are still mostly analyzed using methods based on peak-callers for single replicates. The only exception is PePr, which allows peak calling of several replicates. However, PePr does not provide quality measures to assess the result of the peak-calling process. Moreover, its underlying model might not be suitable for the conditions under which the experiments are performed. We propose a new peak-caller called `Sierra Platinum' that not only allows to call peaks for several replicates but also provides a variety of quality measures. Together with integrated visualizations, the quality measures support the assessment of the replicates and the resulting peaks. We show that Sierra Platinum outperforms methods based on single-replicate peak-callers as well as PePr using a newly generated benchmark data set and using real data from the NIH Roadmap Epigenomics Project.

Cognitive abilities, such as memory, learning, language, problem solving, and planning, involve the frontal lobe and other brain areas. Not much is known yet about the molecular basis of cognitive abilities, but it seems clear that cognitive abilities are determined by the interplay of many genes. One approach for analyzing the genetic networks involved in cognitive functions is to study the coexpression networks of genes with known importance for proper cognitive functions, such as genes that have been associated with cognitive disorders like intellectual disability (ID) or autism spectrum disorders (ASD). Because many of these genes are gene regulatory factors (GRFs) we aimed to provide insights into the gene regulatory networks active in the human frontal lobe. Using genome wide human frontal lobe expression data from 10 independent data sets, we first derived 10 individual coexpression networks for all GRFs including their potential target genes. We observed a high level of variability among these 10 independently derived networks, pointing out that relying on results from a single study can only provide limited biological insights. To instead focus on the most confident information from these 10 networks we developed a method for integrating such independently derived networks into a consensus network. This consensus network revealed robust GRF interactions that are conserved across the frontal lobes of different healthy human individuals. Within this network, we detected a strong central module that is enriched for 166 GRFs known to be involved in brain development and/or cognitive disorders. Interestingly, several hubs of the consensus network encode for GRFs that have not yet been associated with brain functions. Their central role in the network suggests them as excellent new candidates for playing an essential role in the regulatory network of the human frontal lobe, which should be investigated in future studies.
In the last two decades the study of changes in the genome function that are not induced by changes in DNA has consolidated a strong research field called ”epigenetics”. Chromatin state changes play an essential role in the regulation of transcription of many genes, thus controlling cell differentiation. A large part of these changes is due to histone modifications that alter the accessibility of the DNA.
Current state of the art visualization methods for the analysis of epigenetic data sets are not suited to represent the relationship between the combinatorial pattern of histone modifications and their regulatory effects. A recent strategy to generate a global overview of these interactions is the use of scatterplots. One of the biggest weaknesses of scatterplots is the overplotting. This can be solved using a 2D tiled-binned representation strategy, where dividing scatterplot into bins consisting of tiles for each modification pattern is possible. However, this 2D strategy does not allow to represent the interaction of more than two histone modifications.
Here, TiBi-3D, a tool that can visualize the combinatorics of histone modifications with tiled-binned 3D scatterplots, is presented. Two important features of TiBi-3D are that tiles are represented with spheres in the scatterplot, and that their position and color encodes the histone modification pattern they represent. TiBi-3D also includes a transparency value assigned to each of that spheres to depict the amount of data points in each bin. In addition, to reduce the occlusion in the scatterplot each transparency value is initially filtered by an outlier detection, transformed to log scale, and then normalized. TiBi-3D provides features for exploration and interaction with the scatterplot and the data, thus enabling to examine the data set thoroughly. It is also possible to export the results as figures or in bed file format for further processing. By using TiBi-3D, for example, it was possible to observe new relations between the CpG-density and histone modifications in different cell types. In conclusion, TiBi-3D is an excellent tool for the analysis of global patterns in epigenetic data.