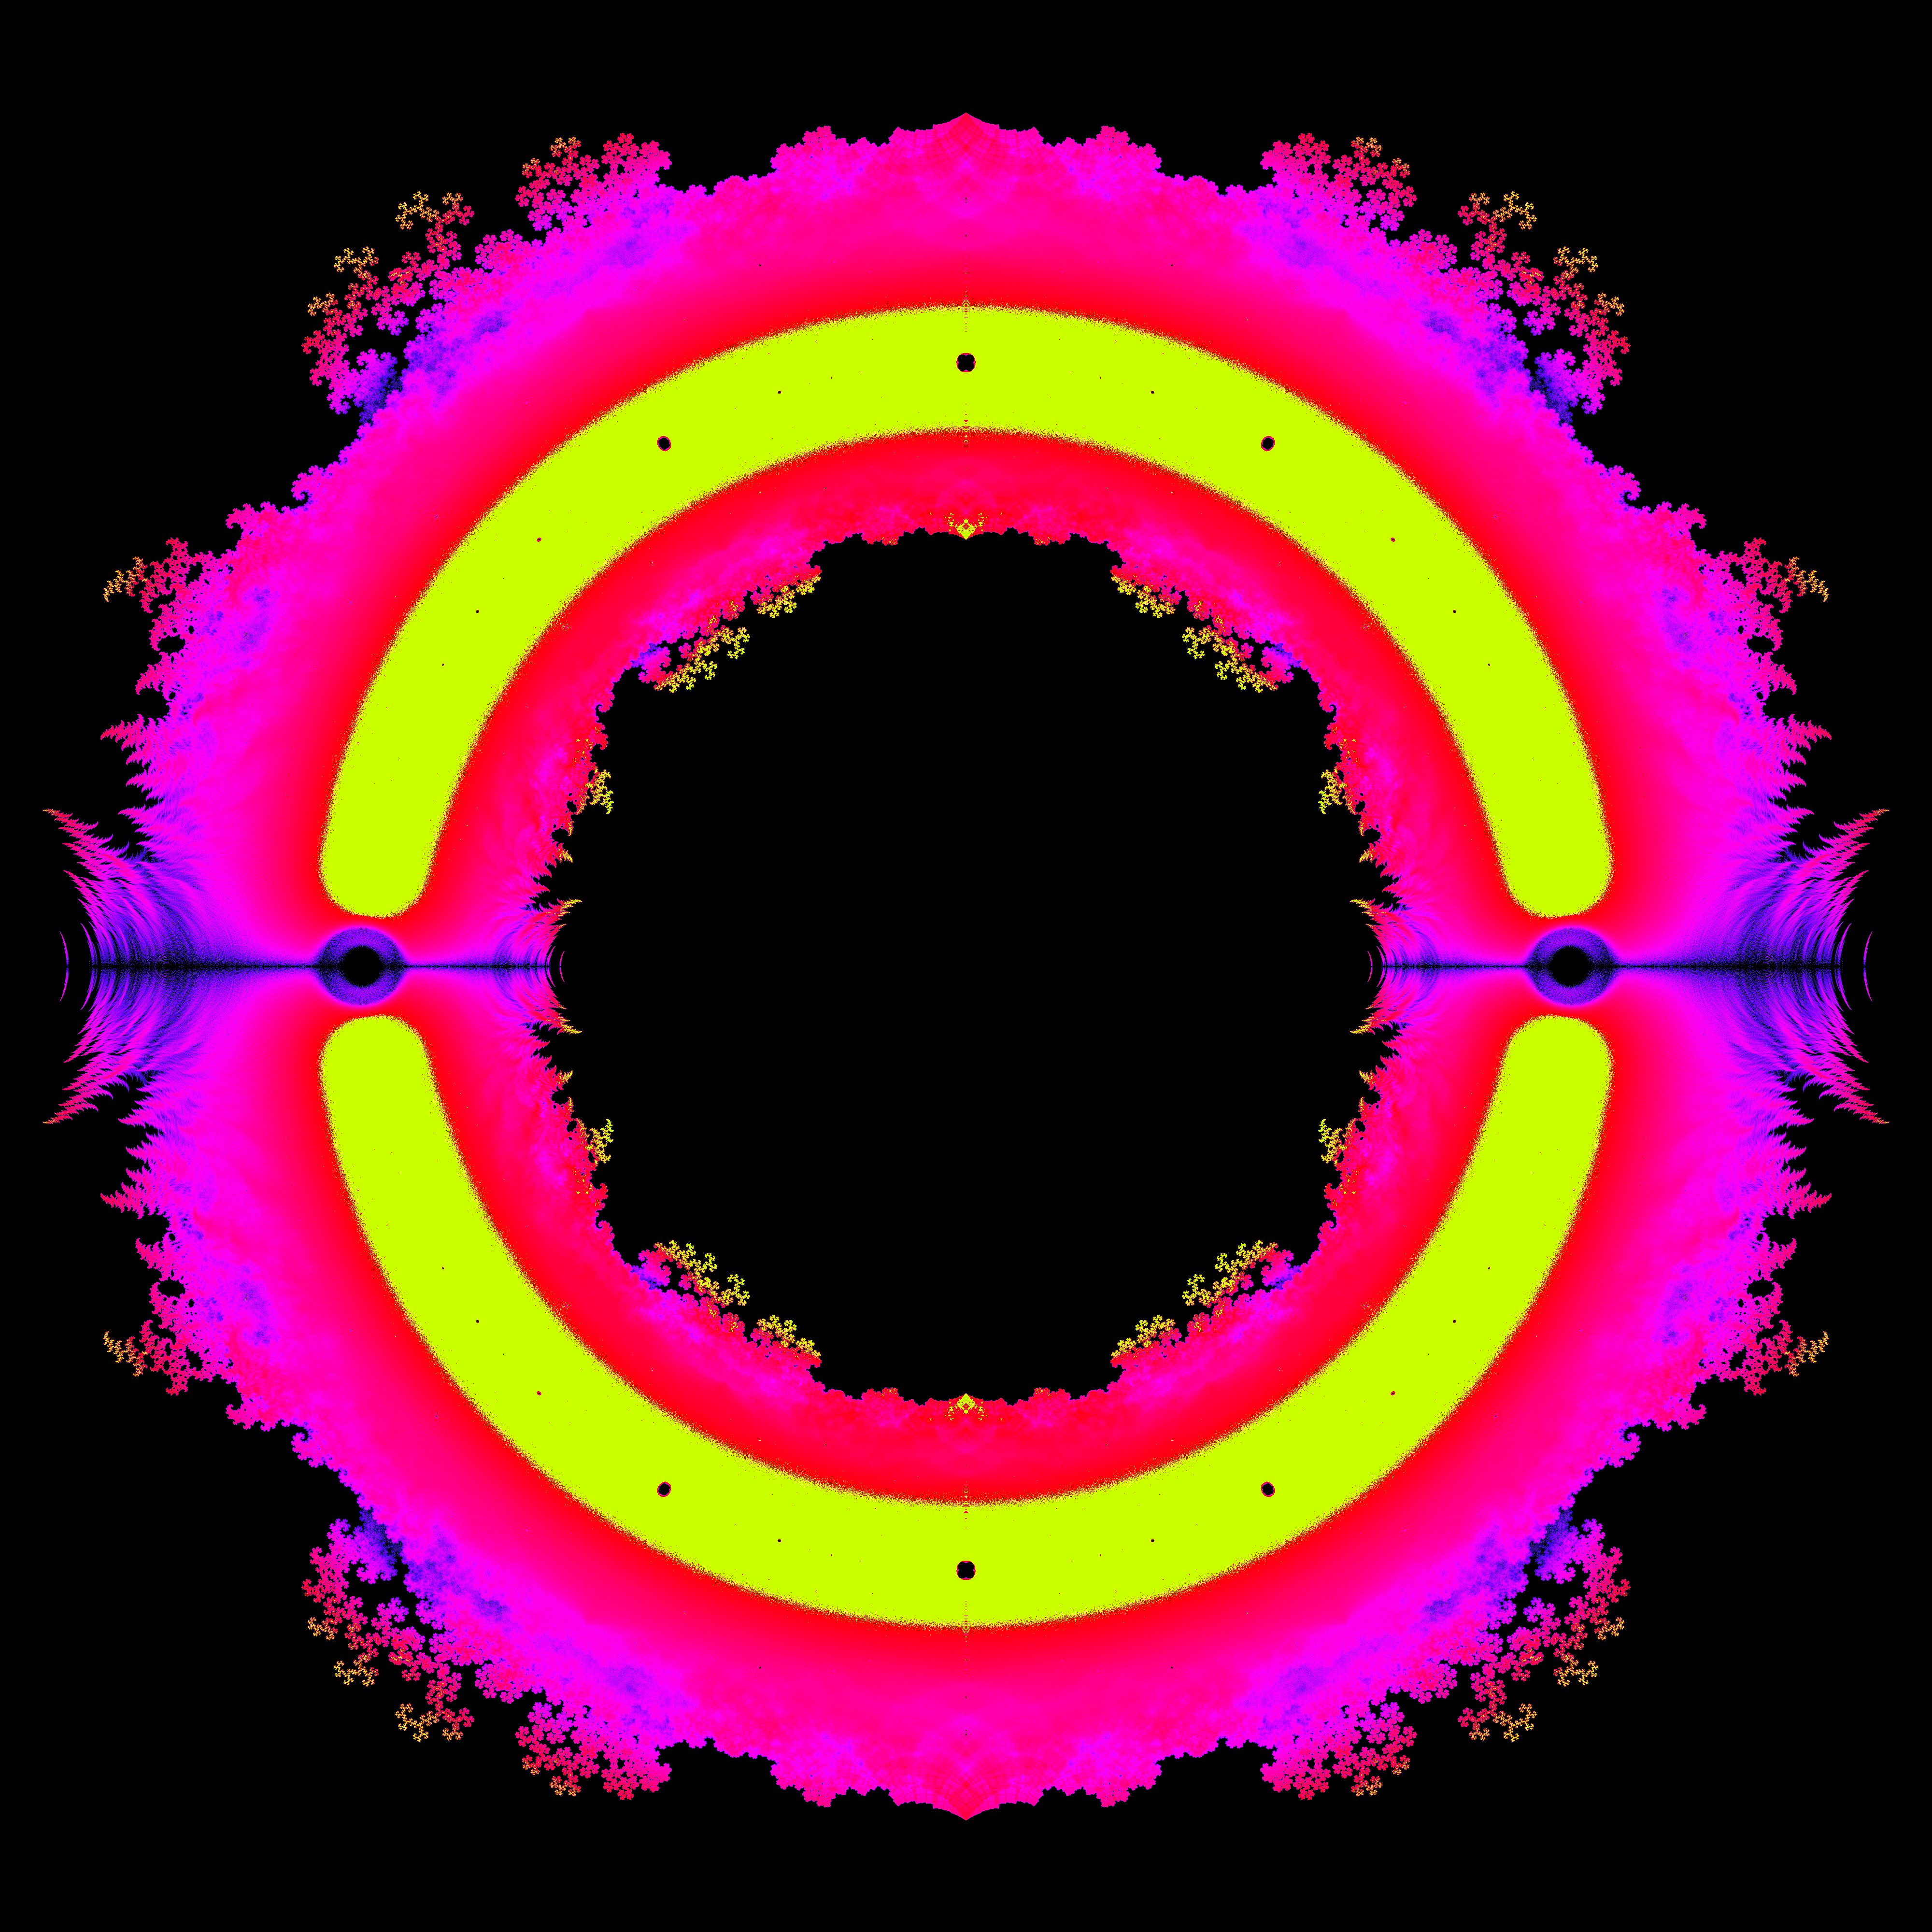
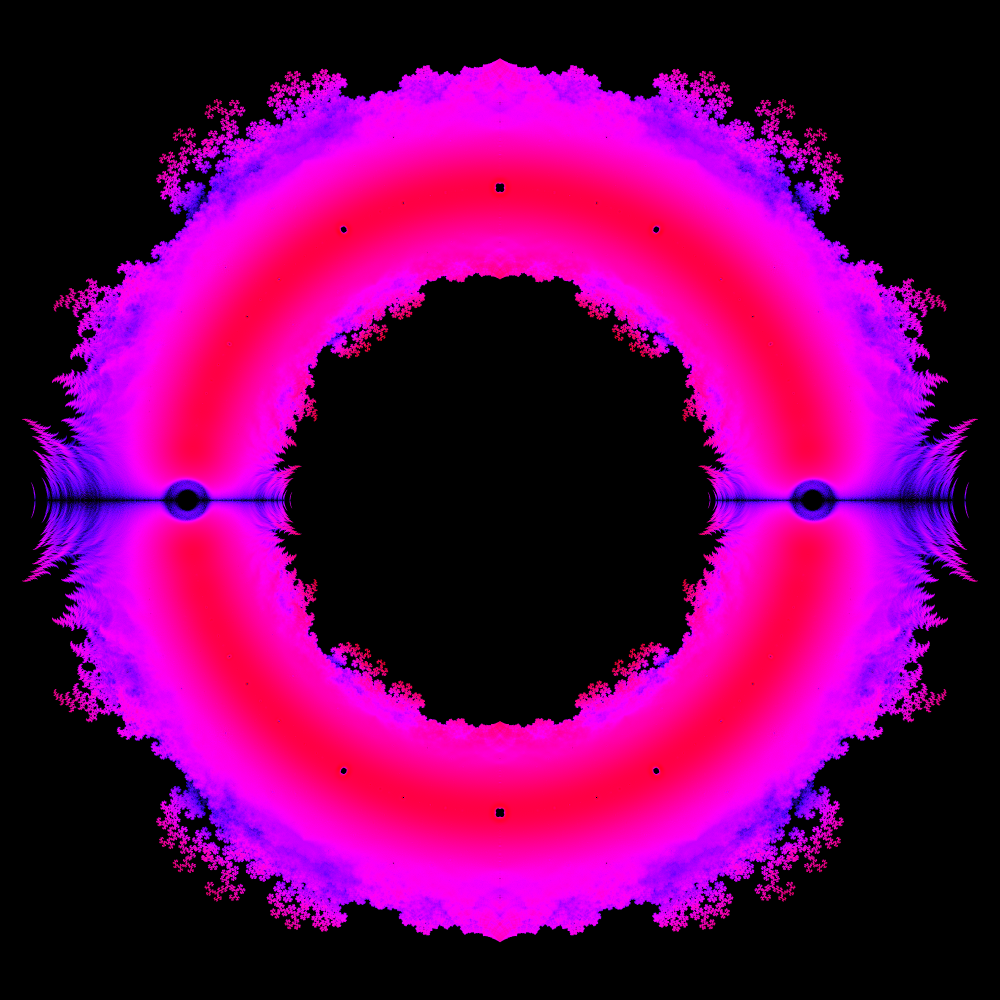
In mathematics, fractals do not only occur as the product of special curves, but can also represent the result space of typical arithmetic operations. Thus all polynomials with the coefficients -1 and 1 form the following fractal up to a certain degree:

In the generated image the complex roots were calculated for all polynomials with the coefficients -1 and 1 up to degree 40. The real part is used as x-coordinate and the imaginary part as y-coordinate.This results, for example, in various dragon fractals.
Additionally, the frequency of a zero at a coordinate can be coded by the color value, resulting in the following images:
More background information about these fractals can be found at Link.
In the first approach to calculate the roots of all polynomials up to a certain degree, Laguerre's Method (https://mathworld.wolfram.com/LaguerresMethod.html) was used to approximate all complex roots. All roots with no imaginary part were discarded. Laguerre's method works reliably with polynomials with a degree lower than 30. With even larger polynomials the computational time of this method increases very strongly. Therefore, the roots were determined by calculating the eigenvalues of the corresponding matrix (https://en.wikipedia.org/wiki/Characteristic_polynomial). Due to the huge amount of possible polynomials, the calculation was divided into several batches and took place on an HPC cluster. More than 2.8 million CPU hours were spent to calculate the fractal.
To shrink down the amount of necessary storage, the calculated roots were binned into a 10.000 x 6.250 matrix and only the frequency of each root was exported. The exported images have therefore a resolution of 62.5 megapixels.
The data sets are provided as CSV files with x and y coordinates and the frequency. '40-fractal-binned.zip' contains the binned roots normalized to the range 0,10000 on the x-axis and 0,6250 on the y-axis. '40-fractal-coordinates.zip' contains the denormalized roots in the range -4,4 on the x-axis and -2.5,2.5 on the y-axis. As far as known there is no data set with a higher degree.
The data sets are licensed under the Creative Commons Attribution 4.0 International License.
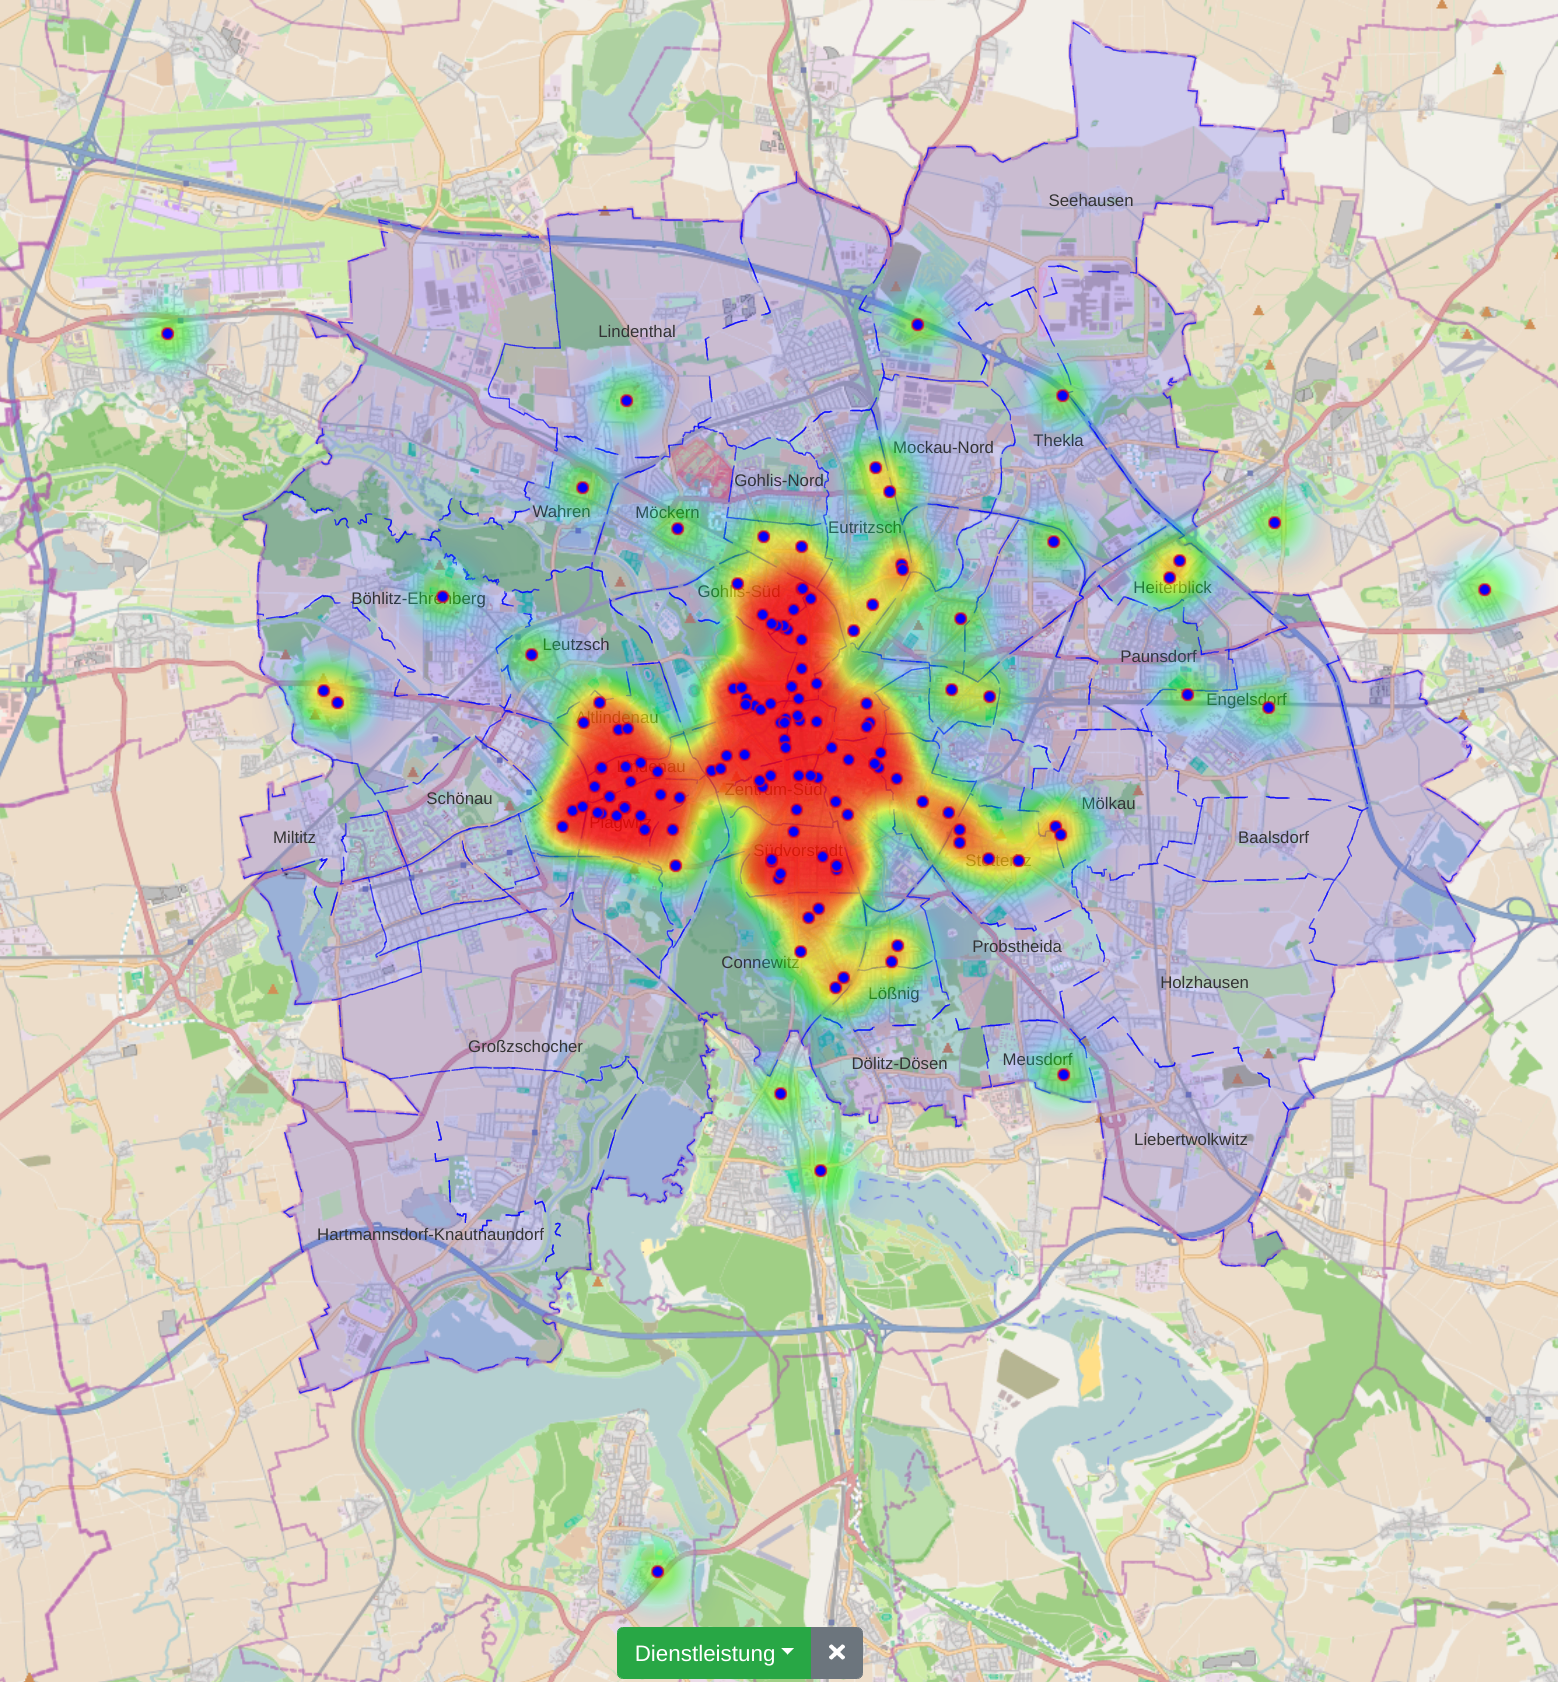
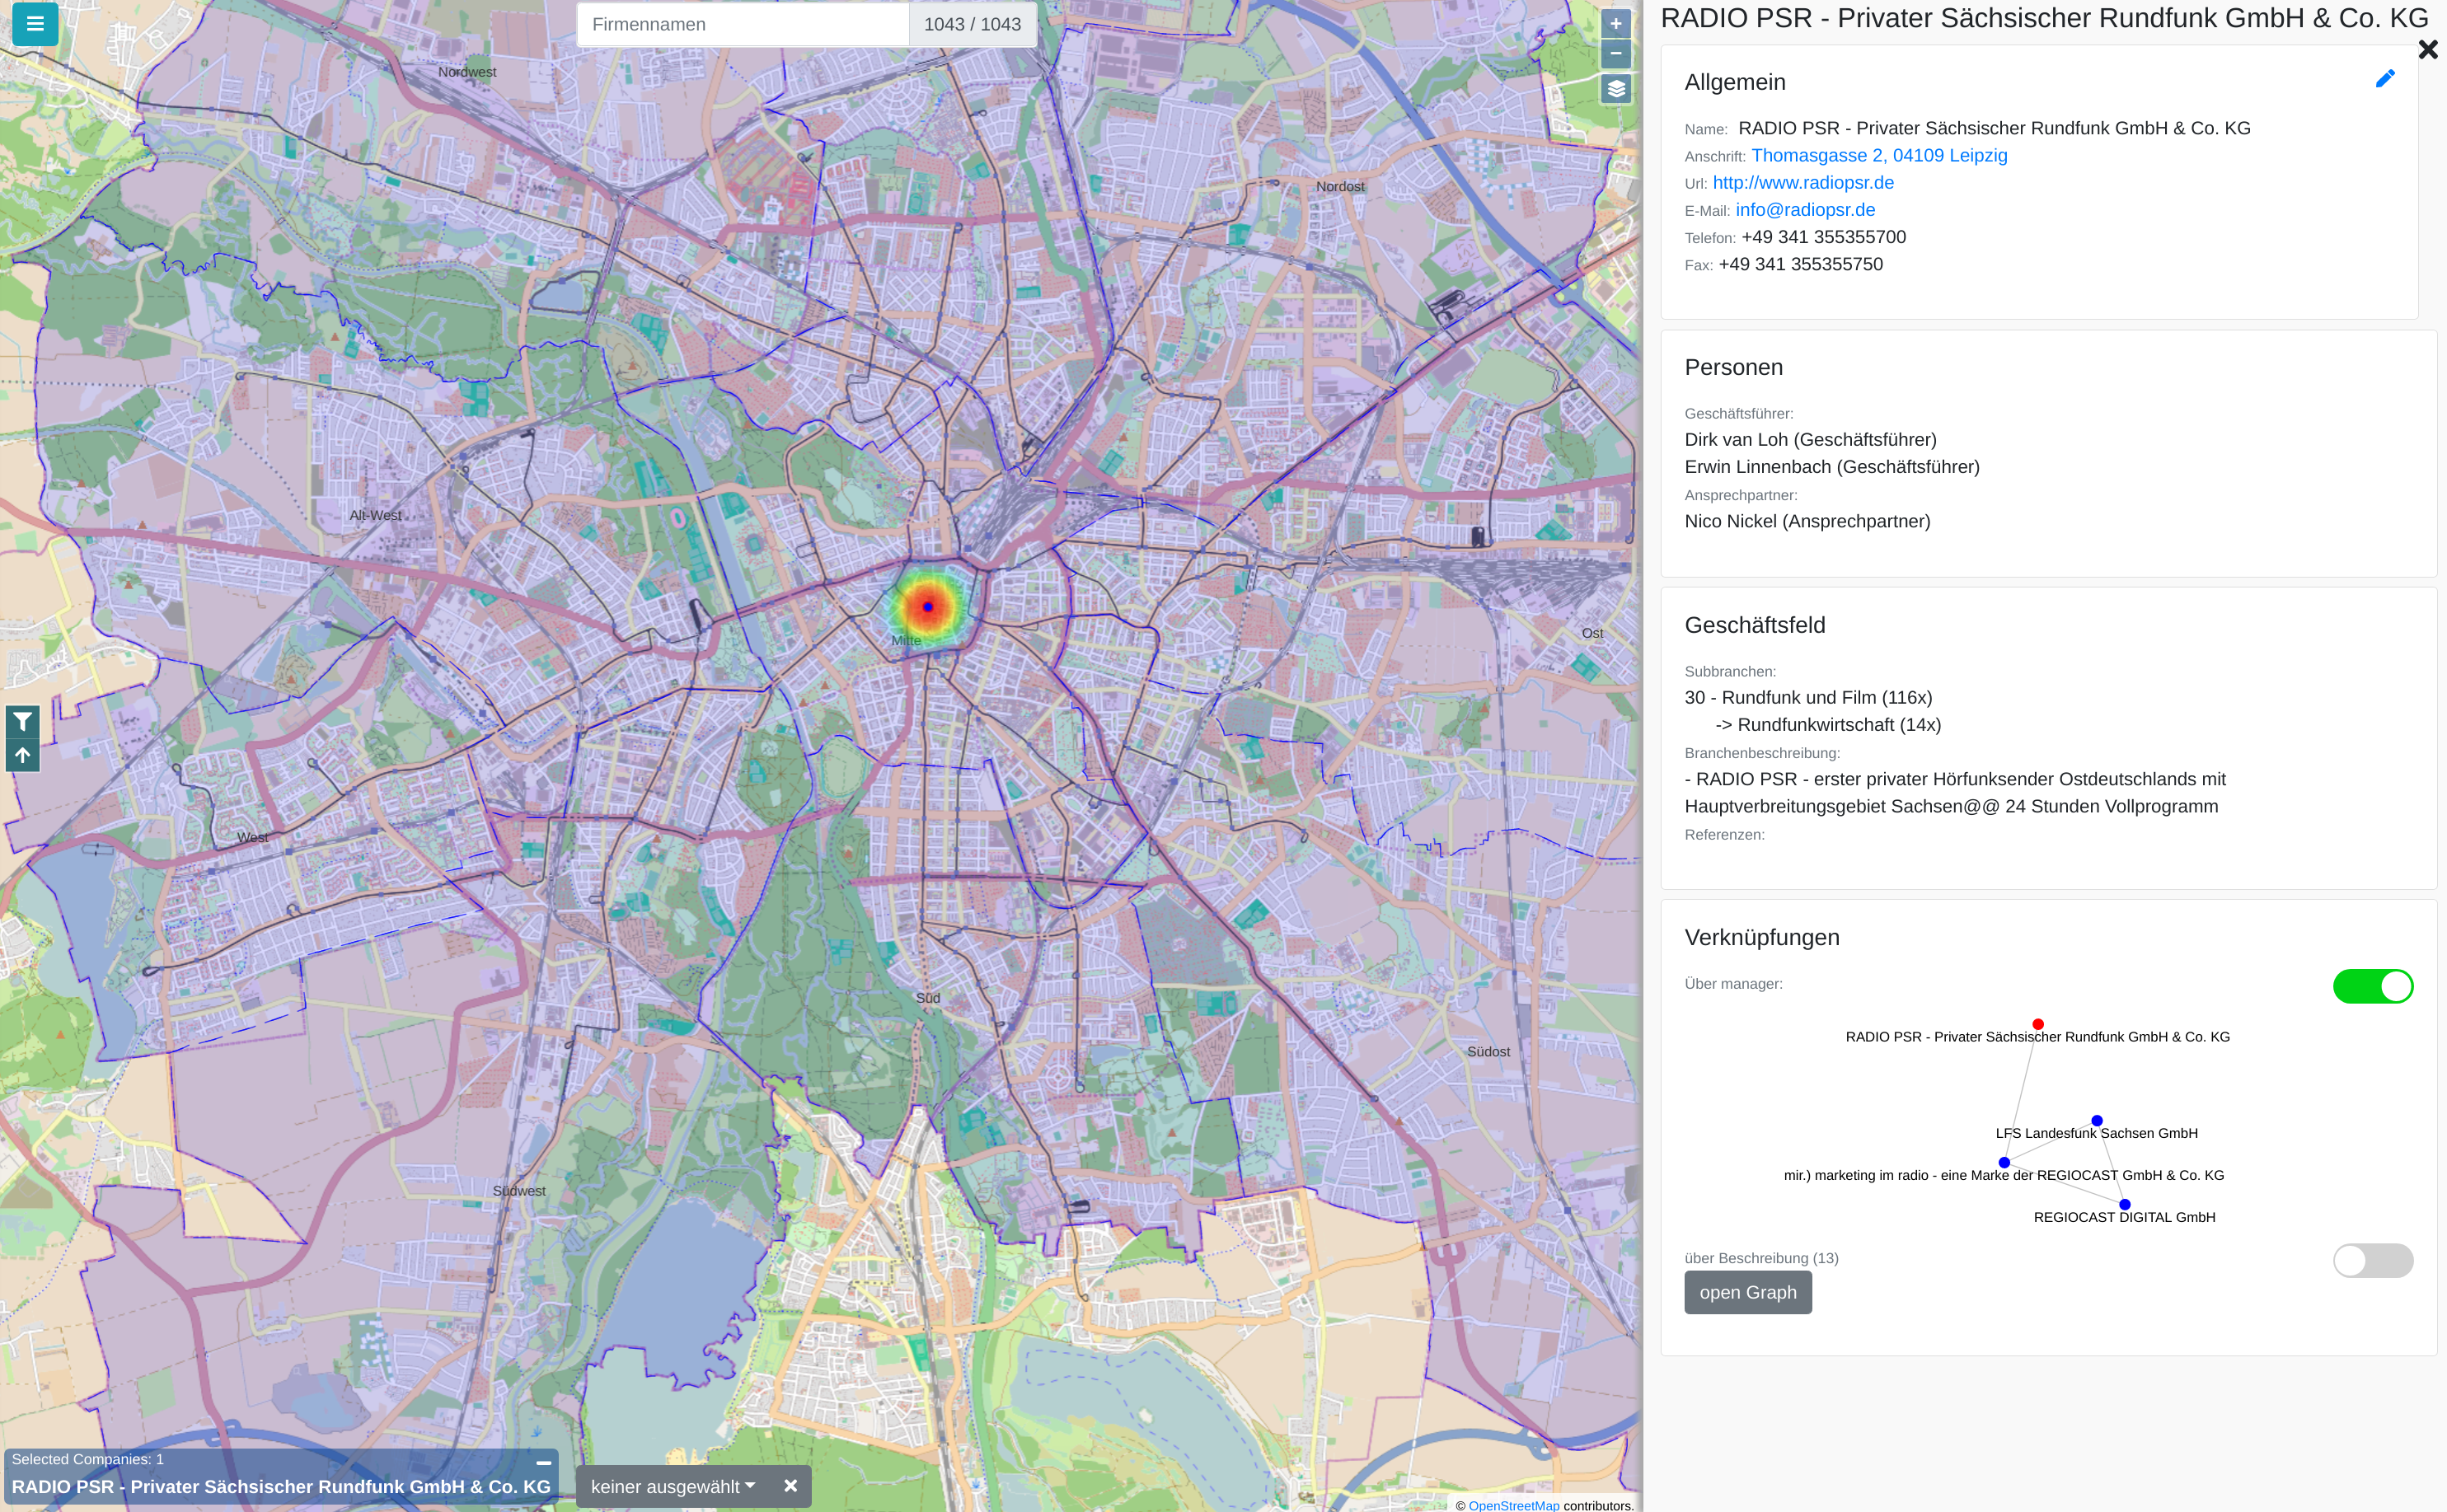
Municipal authorities have, among other tasks, a great interest in supporting their local economy. For this purpose, they provide consulting offices that advise companies and mediate cooperation partners.
The city administration of Leipzig created a business register in which companies can provide their competences in free text fields. This business register contains over 1000 entries and it is not straight forward to find and compare companies based on their self-descriptions.
In this paper, we propose a new visualization to analyze the distribution of local companies and exploring the competence profiles of the companies. In order to visualize connections between companies, we perform a semantical analysis. In detail, we use the management staff listing and the core competence descriptions to link the entries. The company location and the connections between the companies are visualized on a map or as a graph. The visualization provides several filtering and interaction mechanisms on demand. From a governance perspective, this leads to insights into company and industry sector networks within a local economic zone.

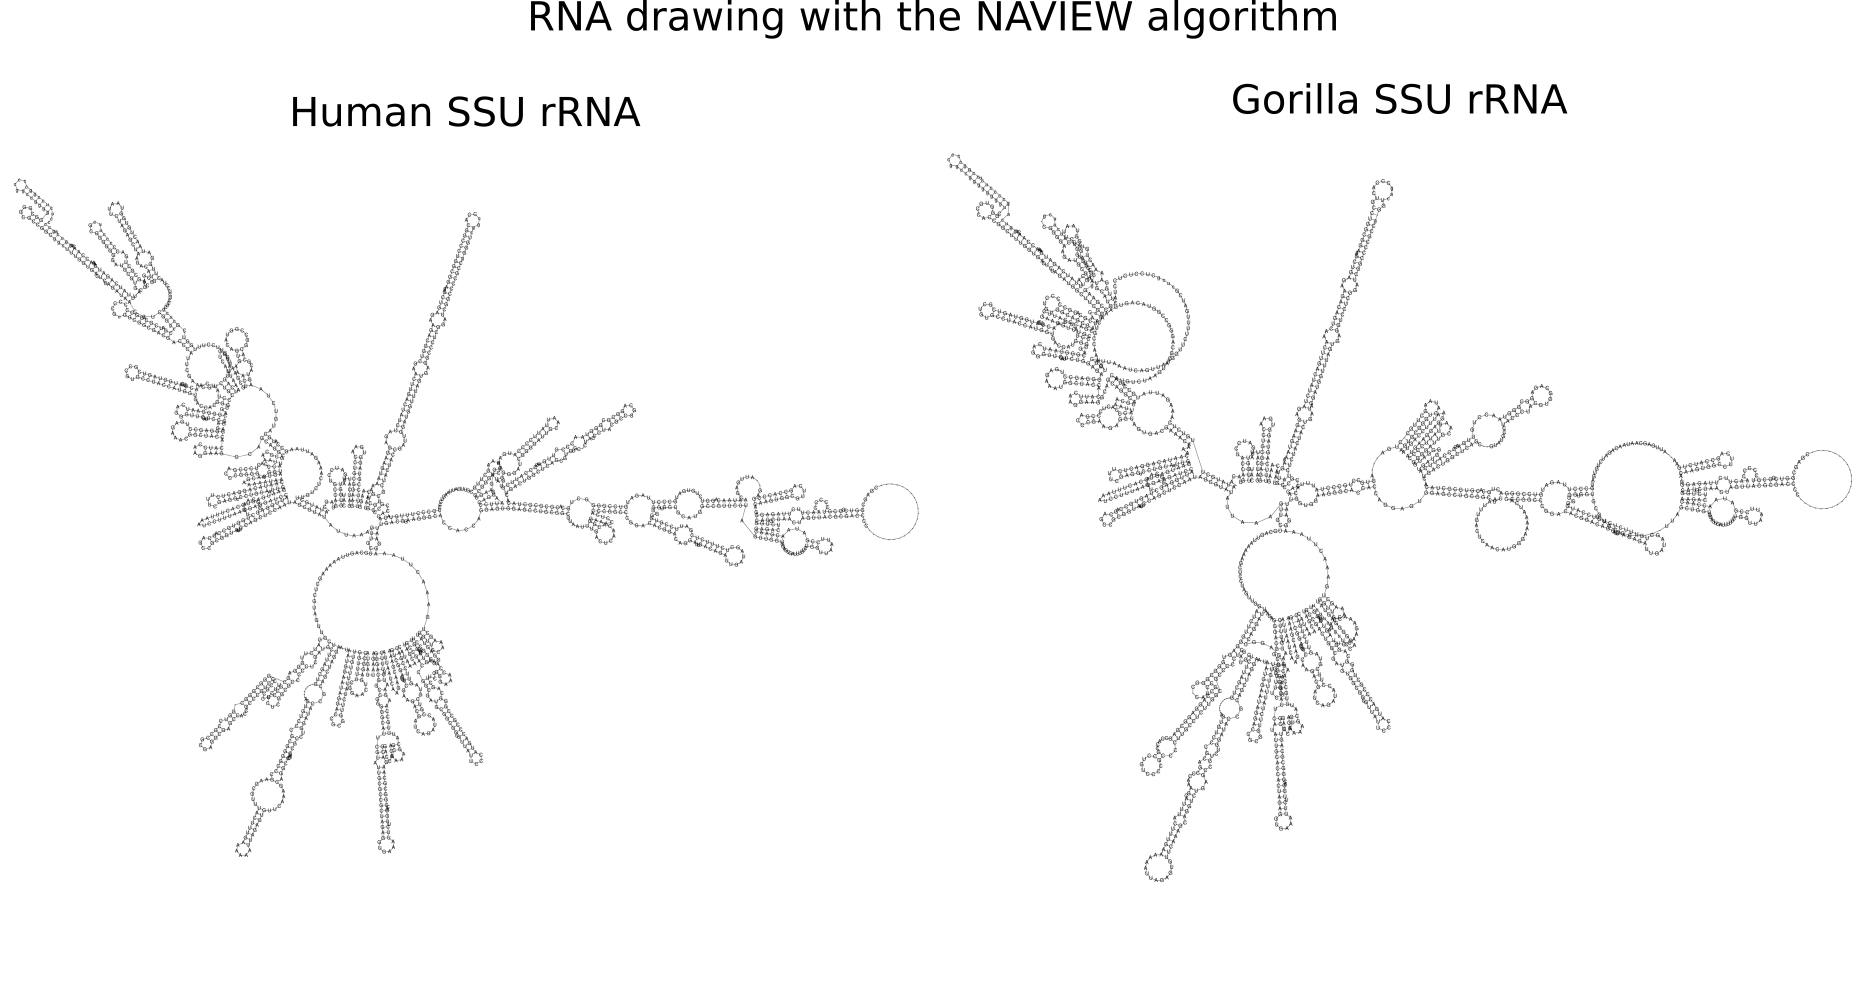
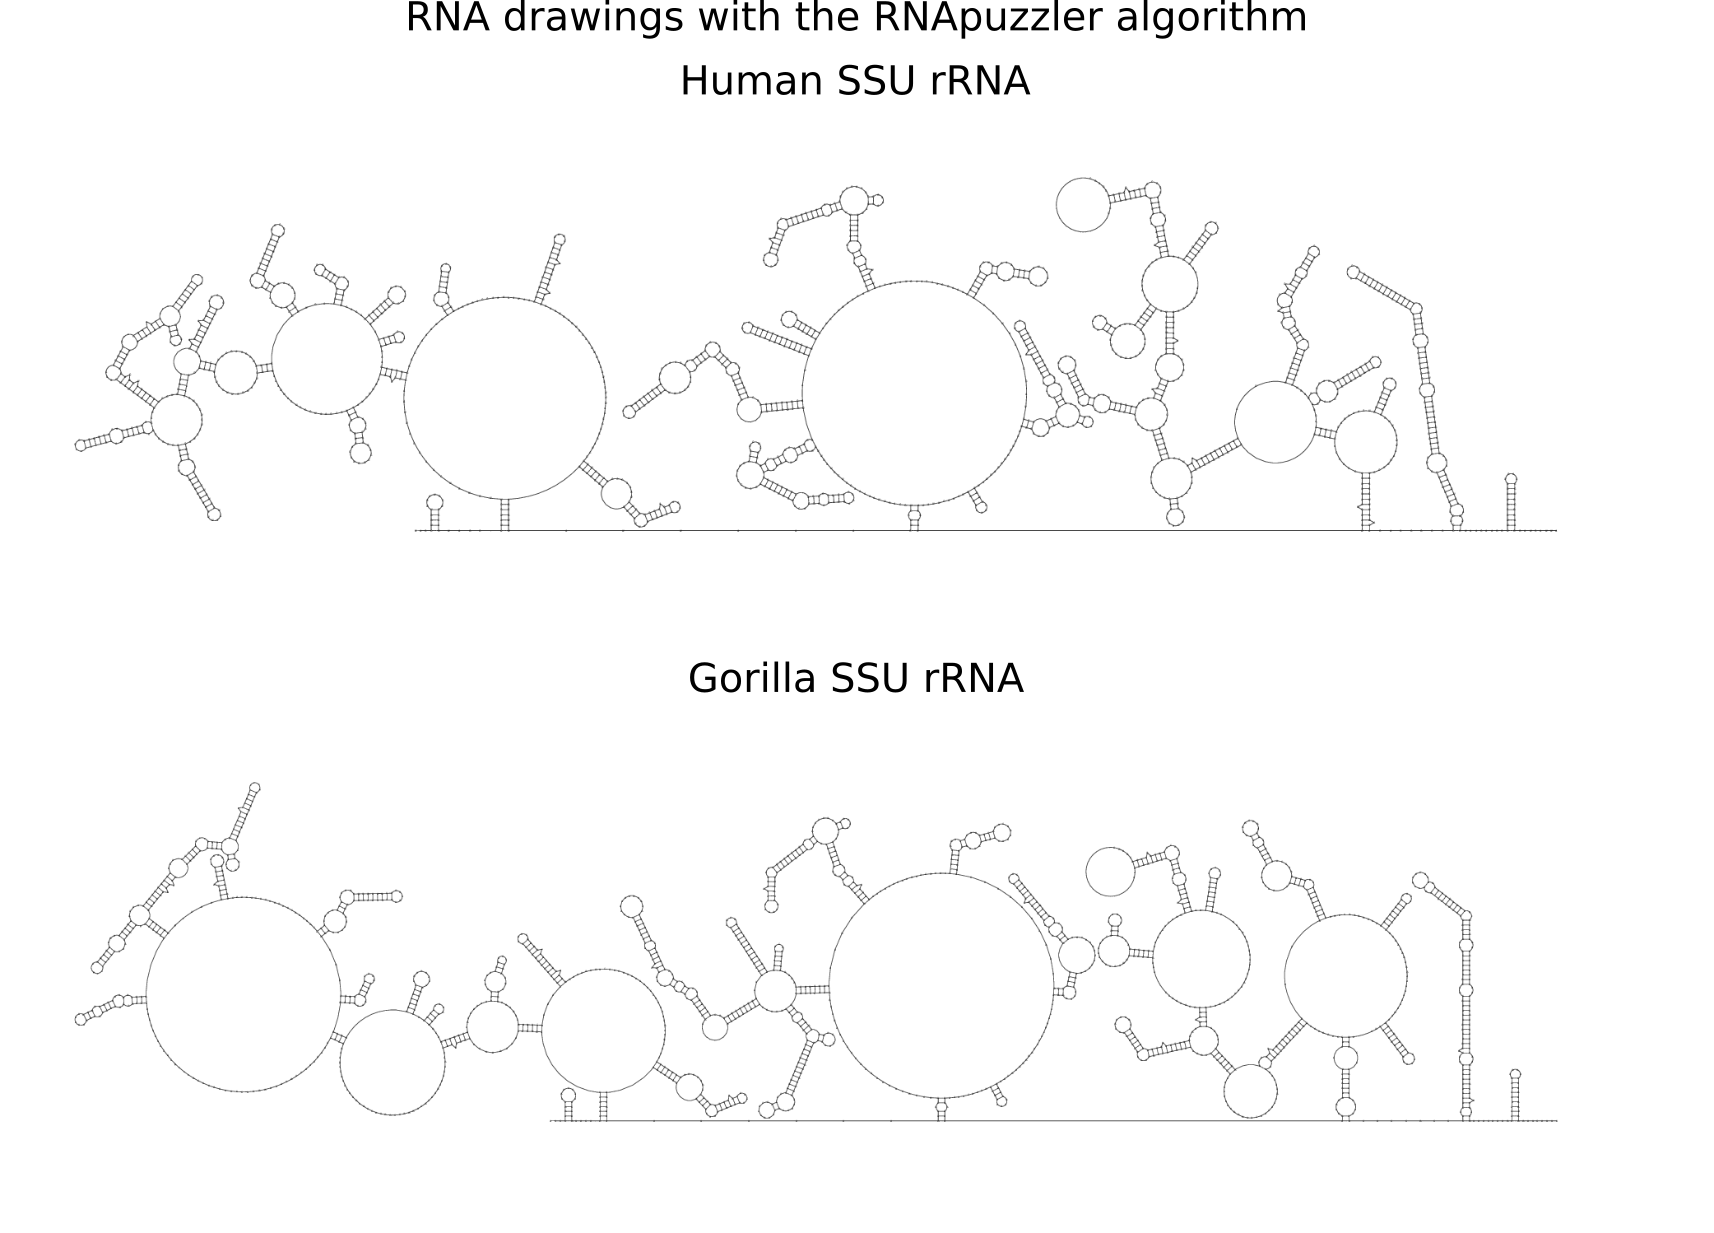
RNA secondary structure is a useful representation for studying the function of RNA, which captures most of the free energy of RNA folding. Using empirically determined energy parameters, secondary structures of nucleic acids can be efficiently computed by recursive algorithms. Several software packages supporting this task are readily available. As RNA secondary structures are outerplanar graphs, they can be drawn without intersection in the plane. Interpretation by the practitioner is eased when these drawings conform to a series of additional constraints beyond outerplanarity. These constraints are the reason why RNA drawing is difficult. Many RNA drawing algorithms therefore do not always produce intersection-free (outerplanar) drawings.
To remedy this shortcoming, we propose here the RNApuzzler algorithm, which is guaranteed to produce intersection-free drawings. It is based on a drawing algorithm respecting constraints based on nucleotide distances (RNAturtle). We investigate relaxations of these constraints allowing for intersection- free drawings. Based on these relaxations, we implemented a fully automated, simple, and robust algorithm that produces aesthetic drawings adhering to previously established guidelines. We tested our algorithm using the RFAM database and found that we can compute intersection-free drawings of all RNAs therein efficiently.


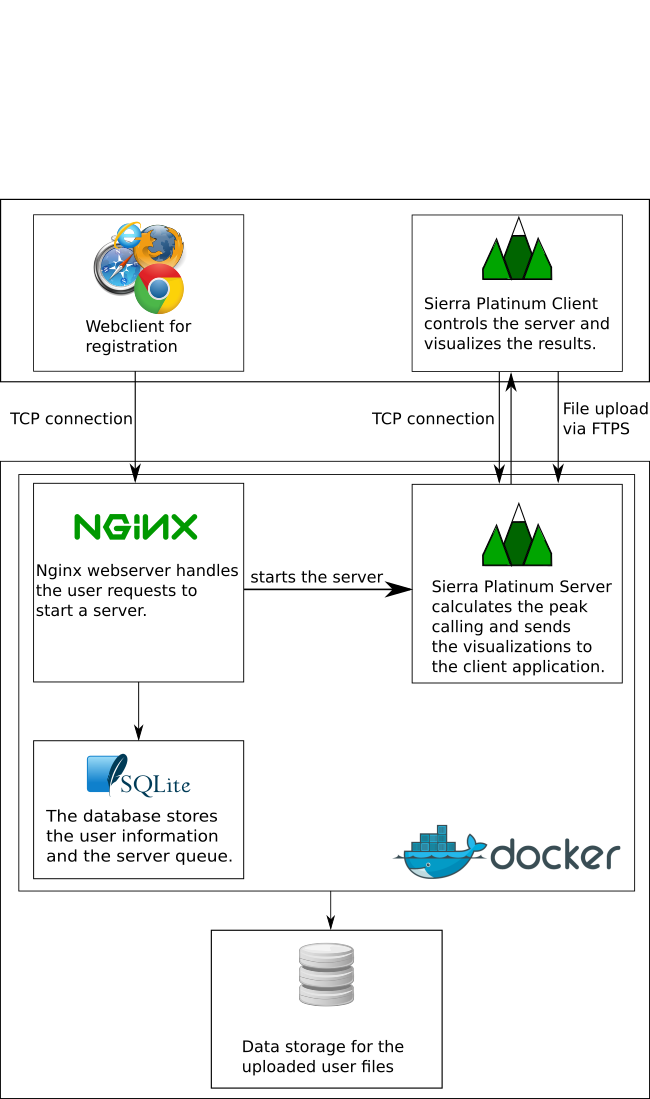
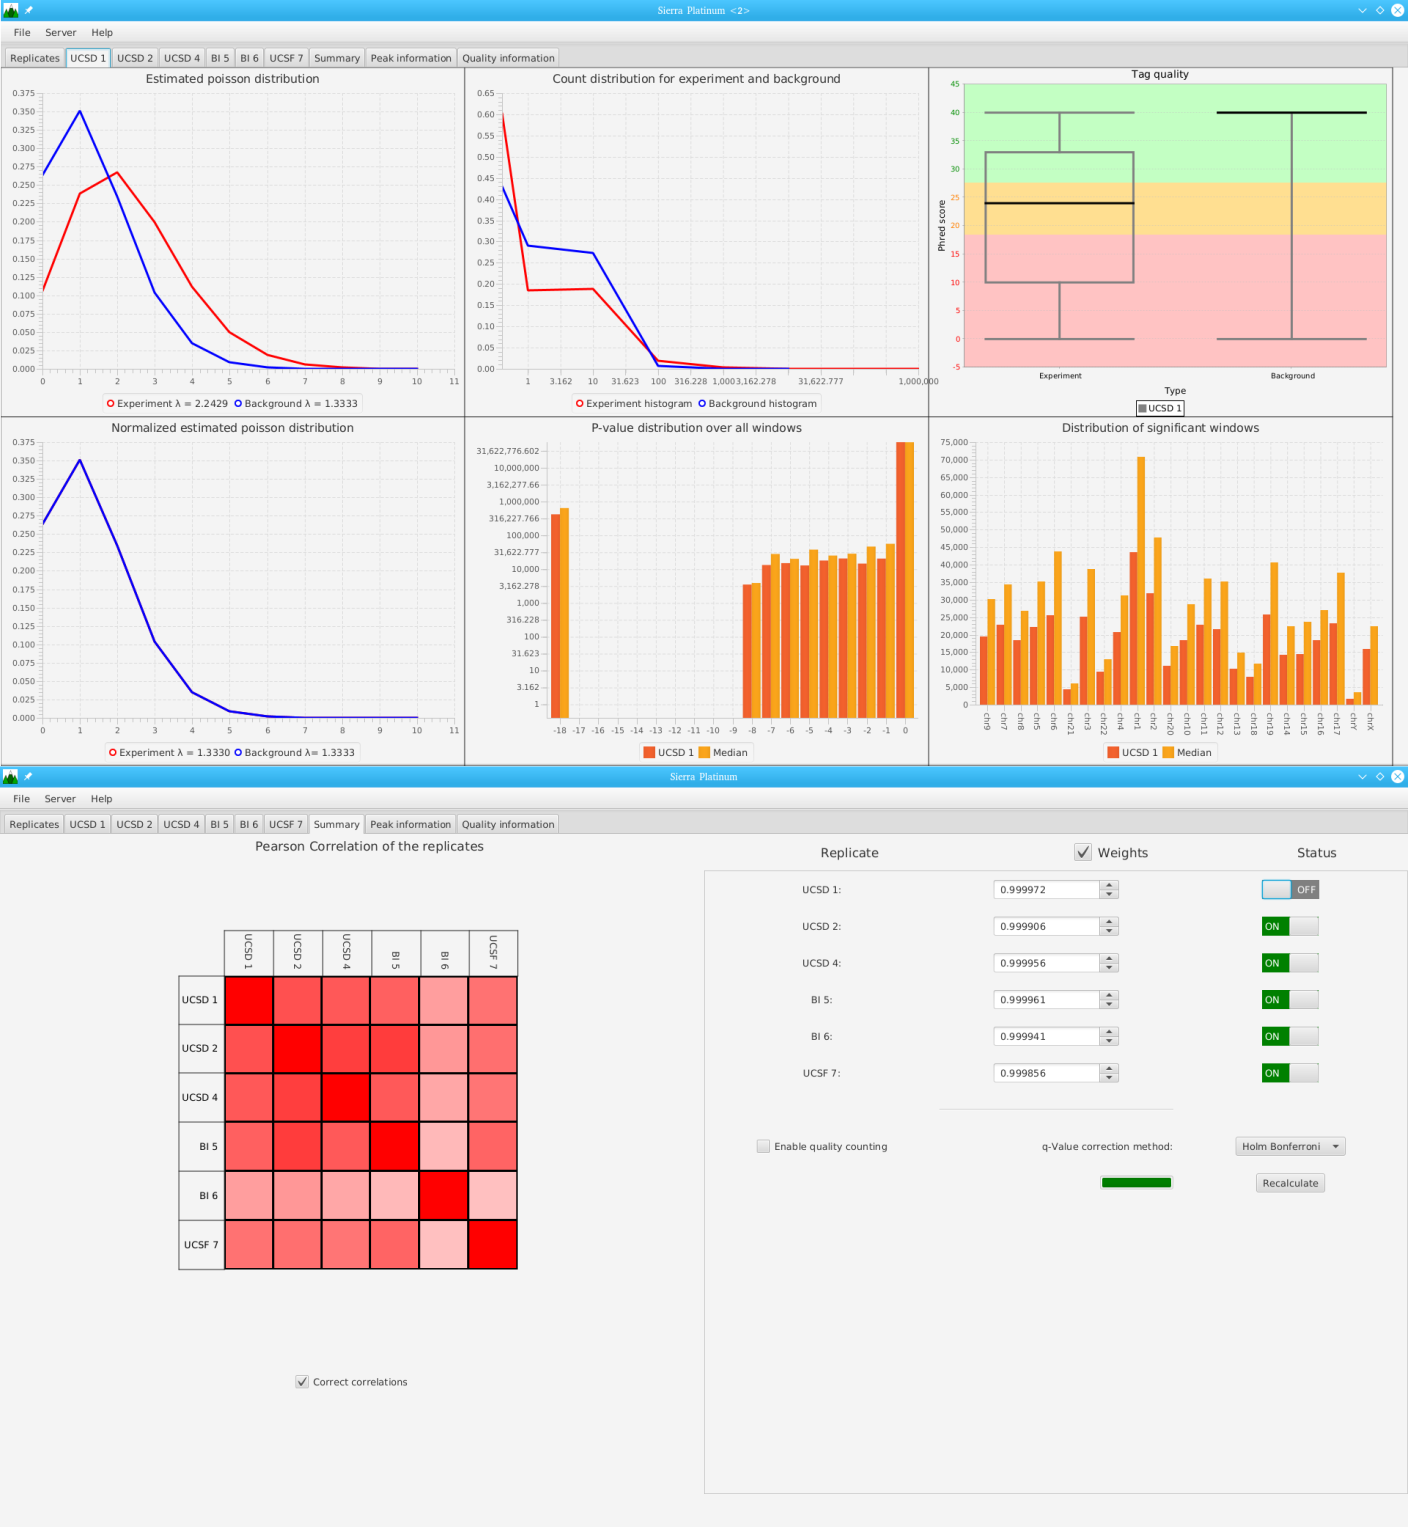
Sierra Platinum is a fast and robust peak-caller for replicated ChIP-seq experiments with visual quality-control and -steering. The required computing resources are optimized but still may exceed the resources available to researchers at biological research institutes. Sierra Platinum Service provides the full functionality of Sierra Platinum: using a web interface, a new instance of the service can be generated. Then experimental data is uploaded and the computation of the peaks is started. Upon completion, the results can be inspected interactively and then downloaded for further analysis, at which point the service terminates.
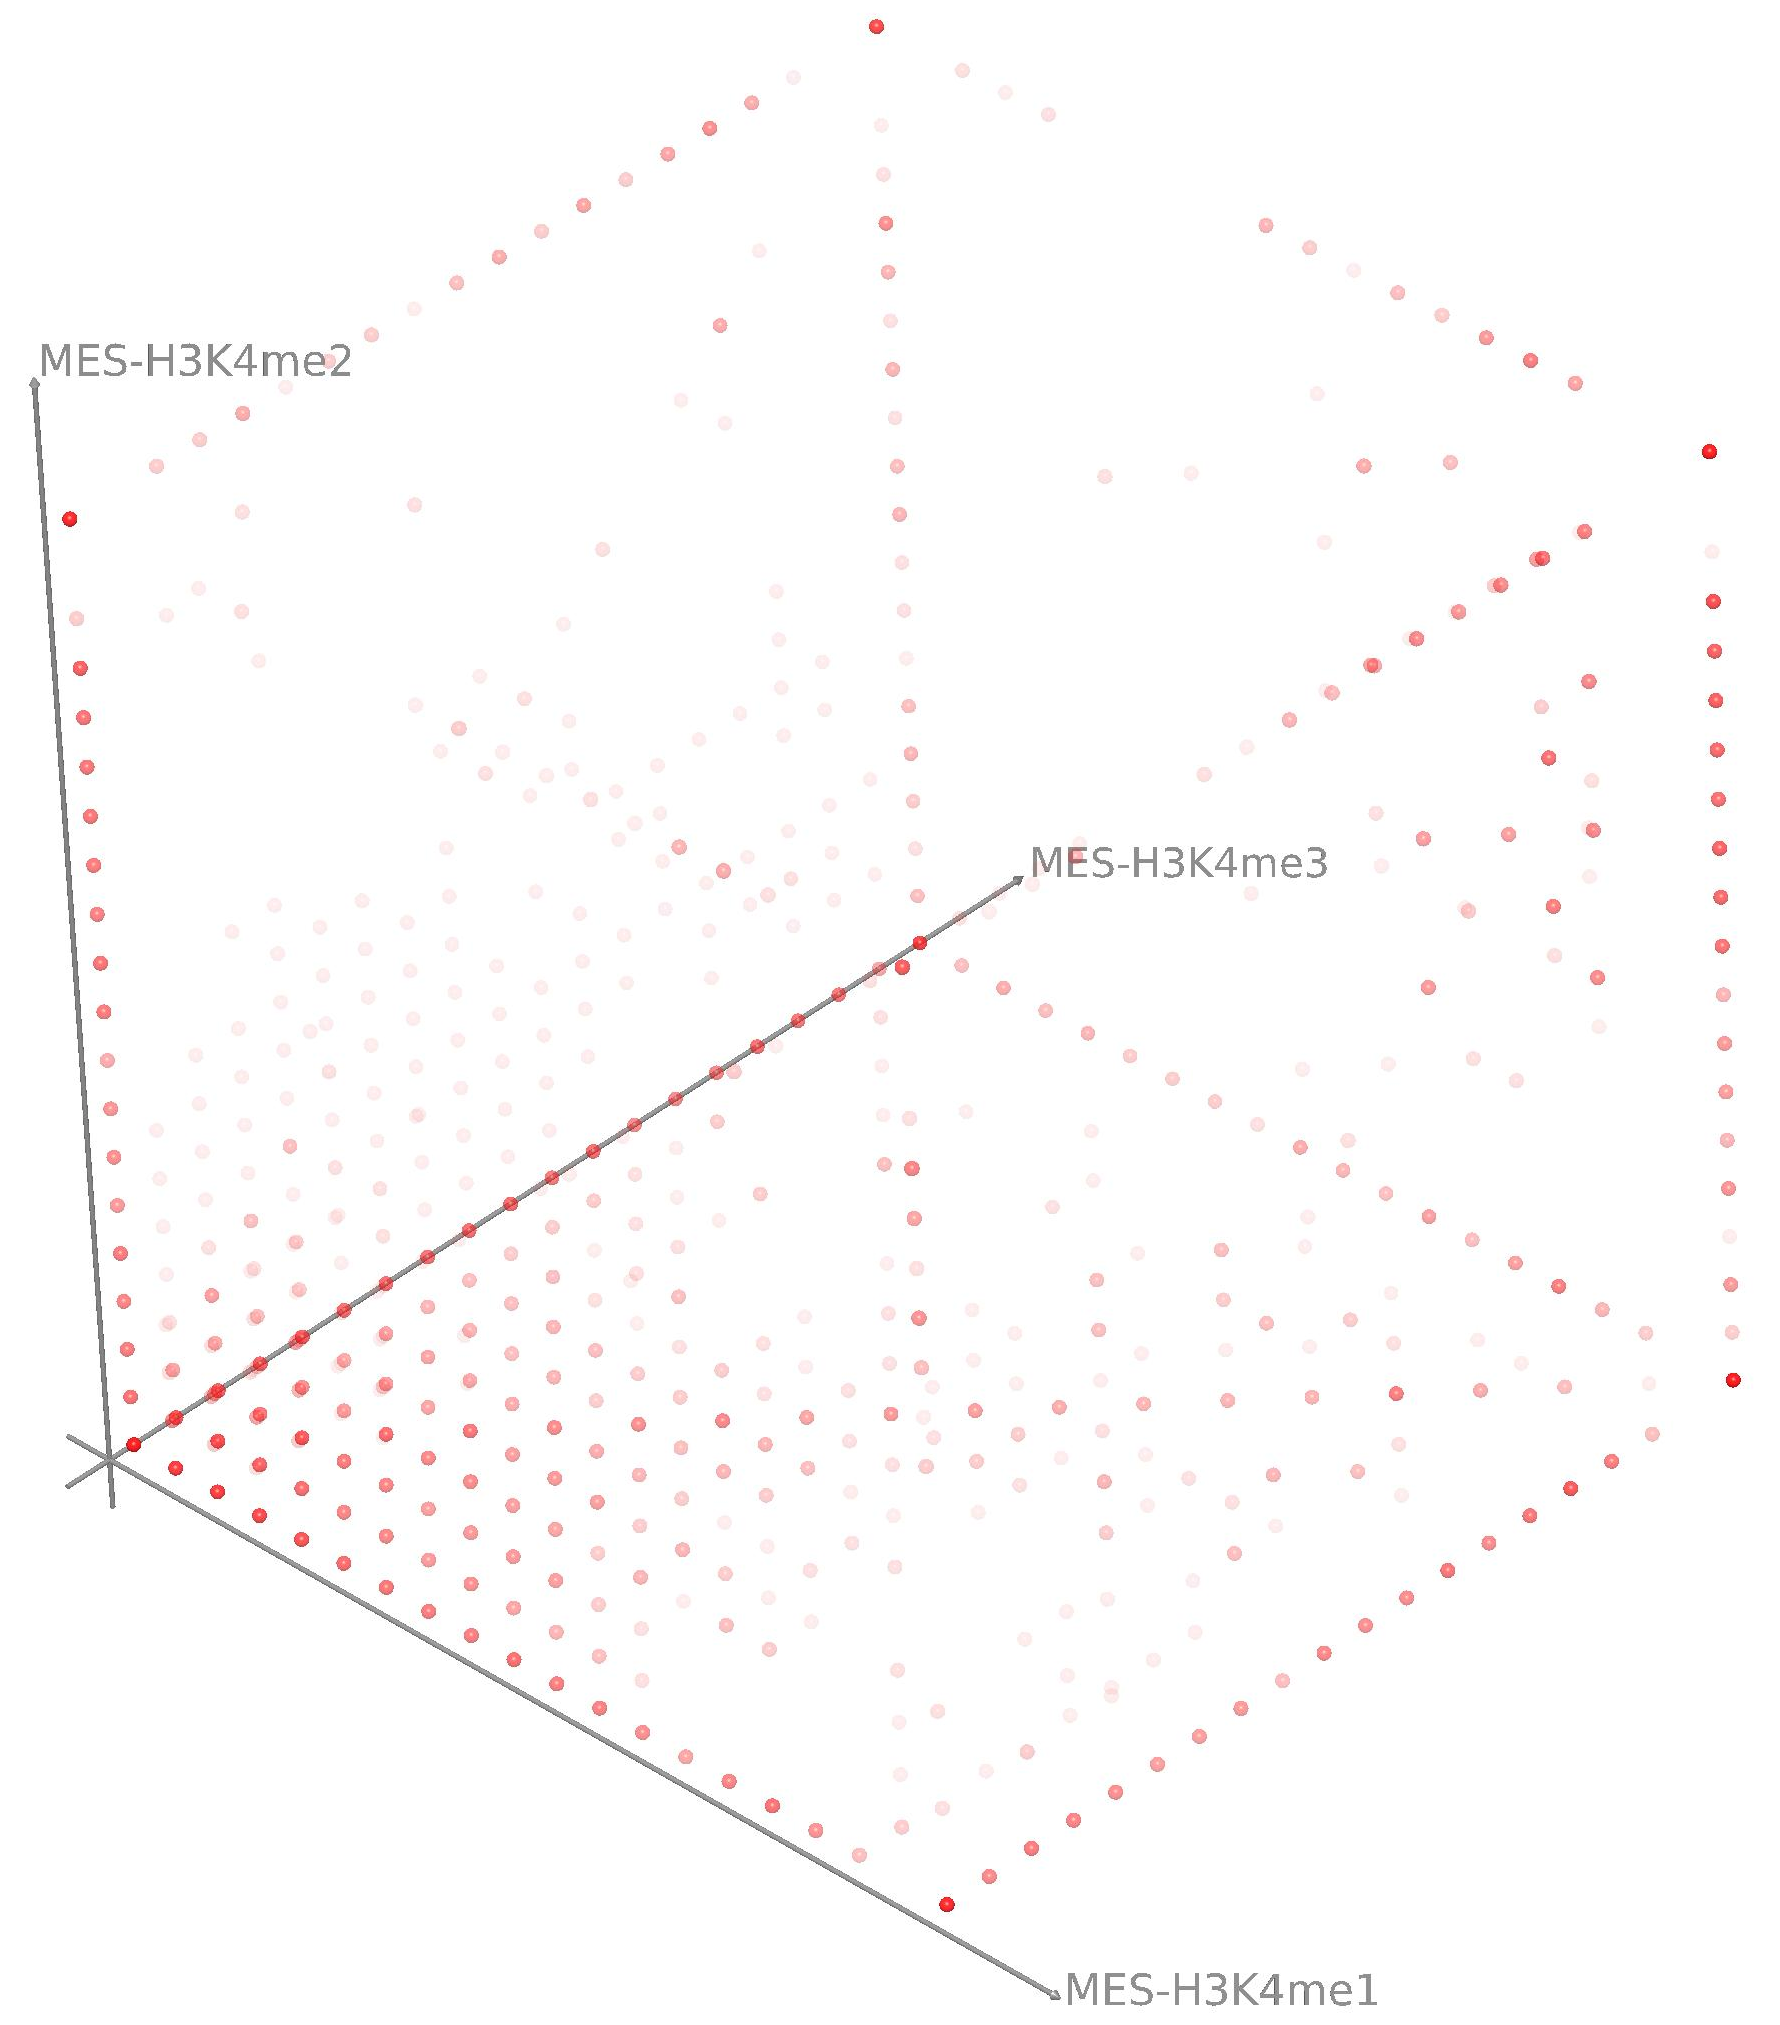
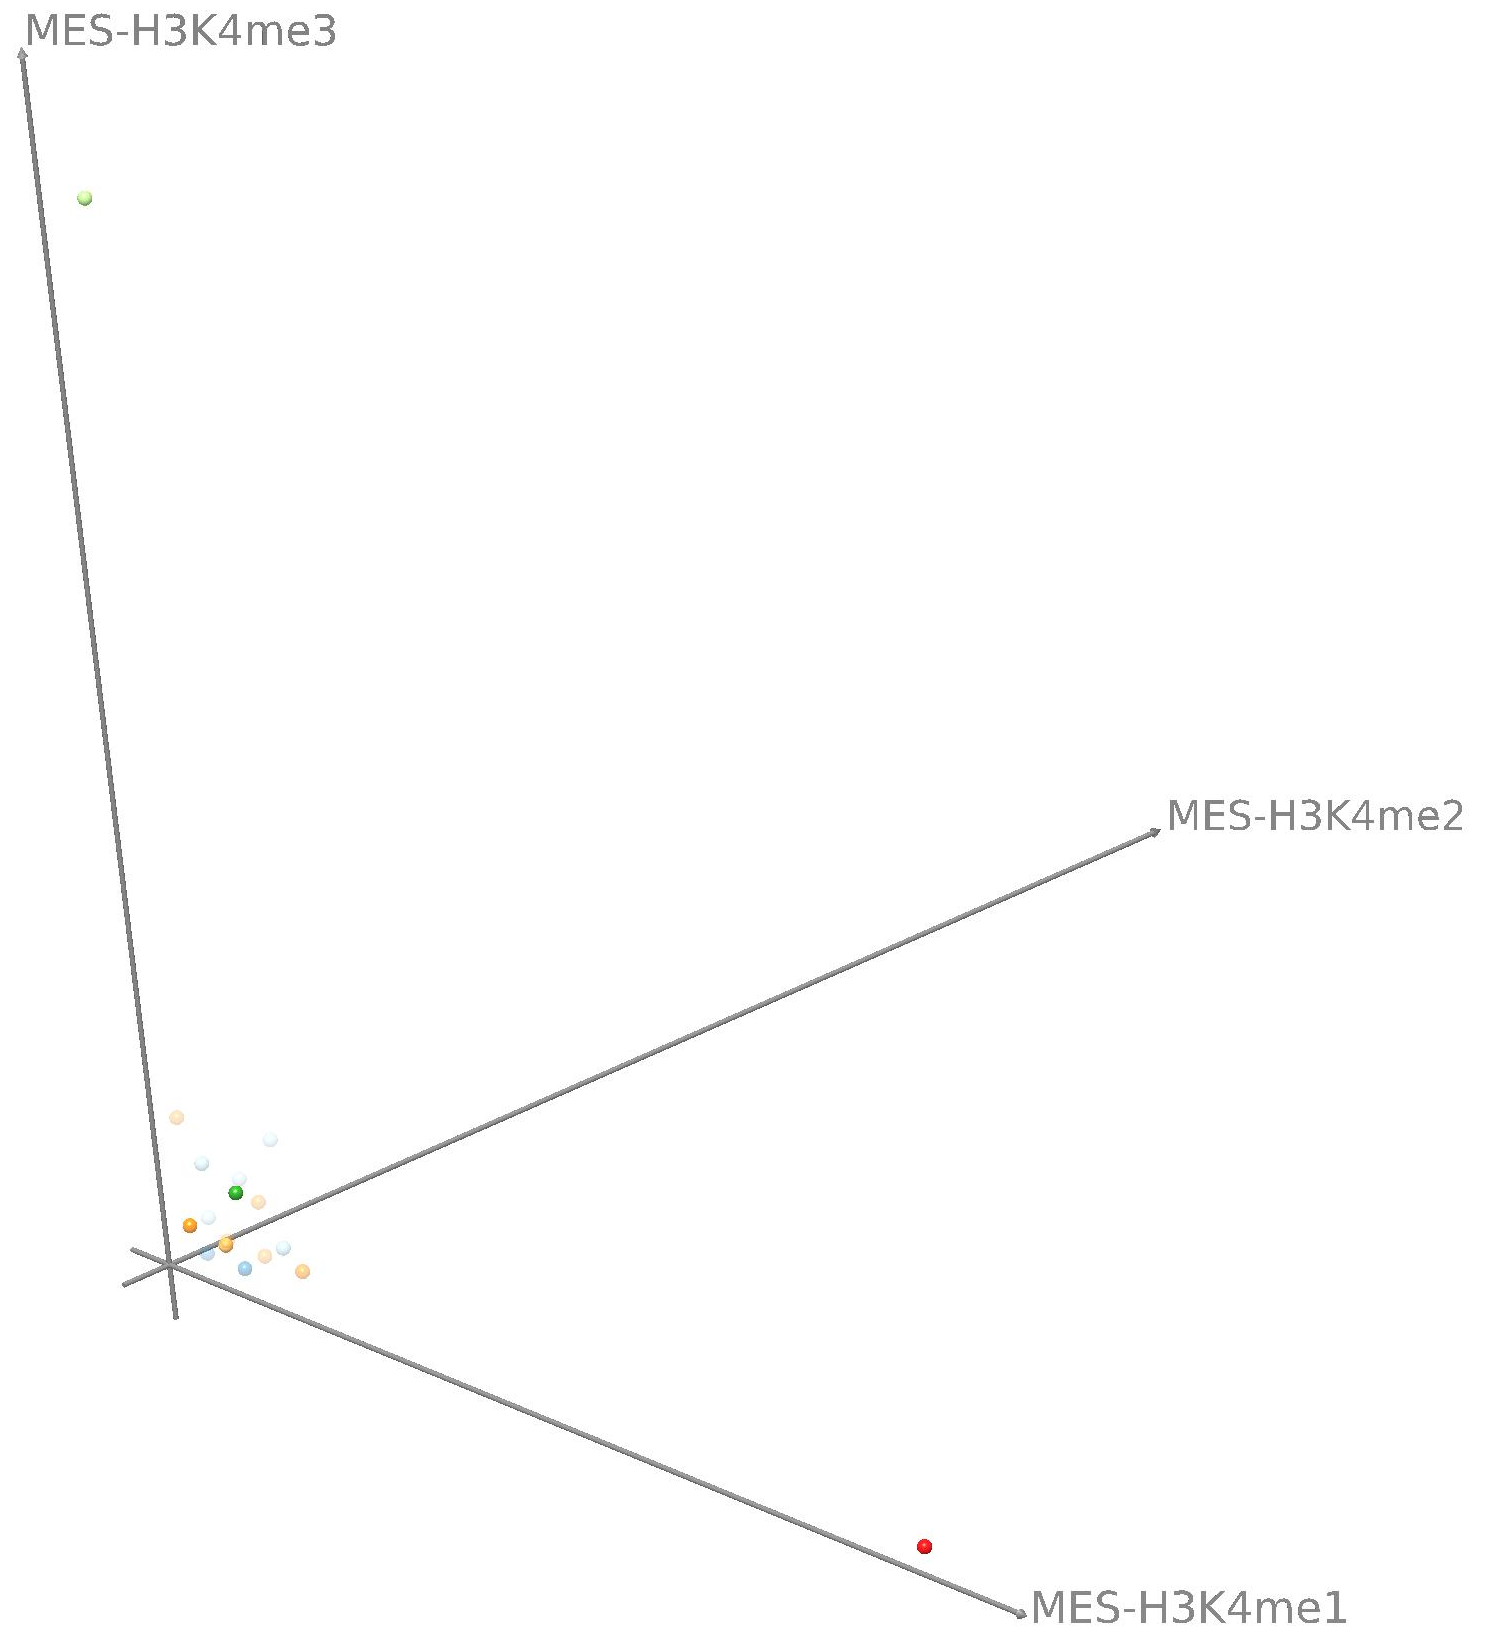
A major goal in epigenetics is understanding how cells differentiate into different cell types. Besides the increase of individual data sets, the amount of replicated experiments generating a tremendous amount of data is ever increasing. While biologists primarily analyze their data on the highest level using statistical correlations or on the lowest level analyzing nucleotide sequences, determining the fate of histone modifications during cell specification necessitates improved analysis capabilities on one or more intermediate levels. For this type of analysis, it proved to be very useful to use tiled binned scatter plot matrices showing binary relationships or to use tiled binned 3D scatter plots showing ternary relationships. Quarternary or general n-ary relationships are not easily analyzable using visualization techniques like scatter plots, only. Therefore, we augmented existing clustering methods with the tiling and binning idea enabling the analysis of n-ary relationships. Analyzing the changes of histone modifications comparing two cell lines using tiled binned clustering, we found new, unknown relations in the data.