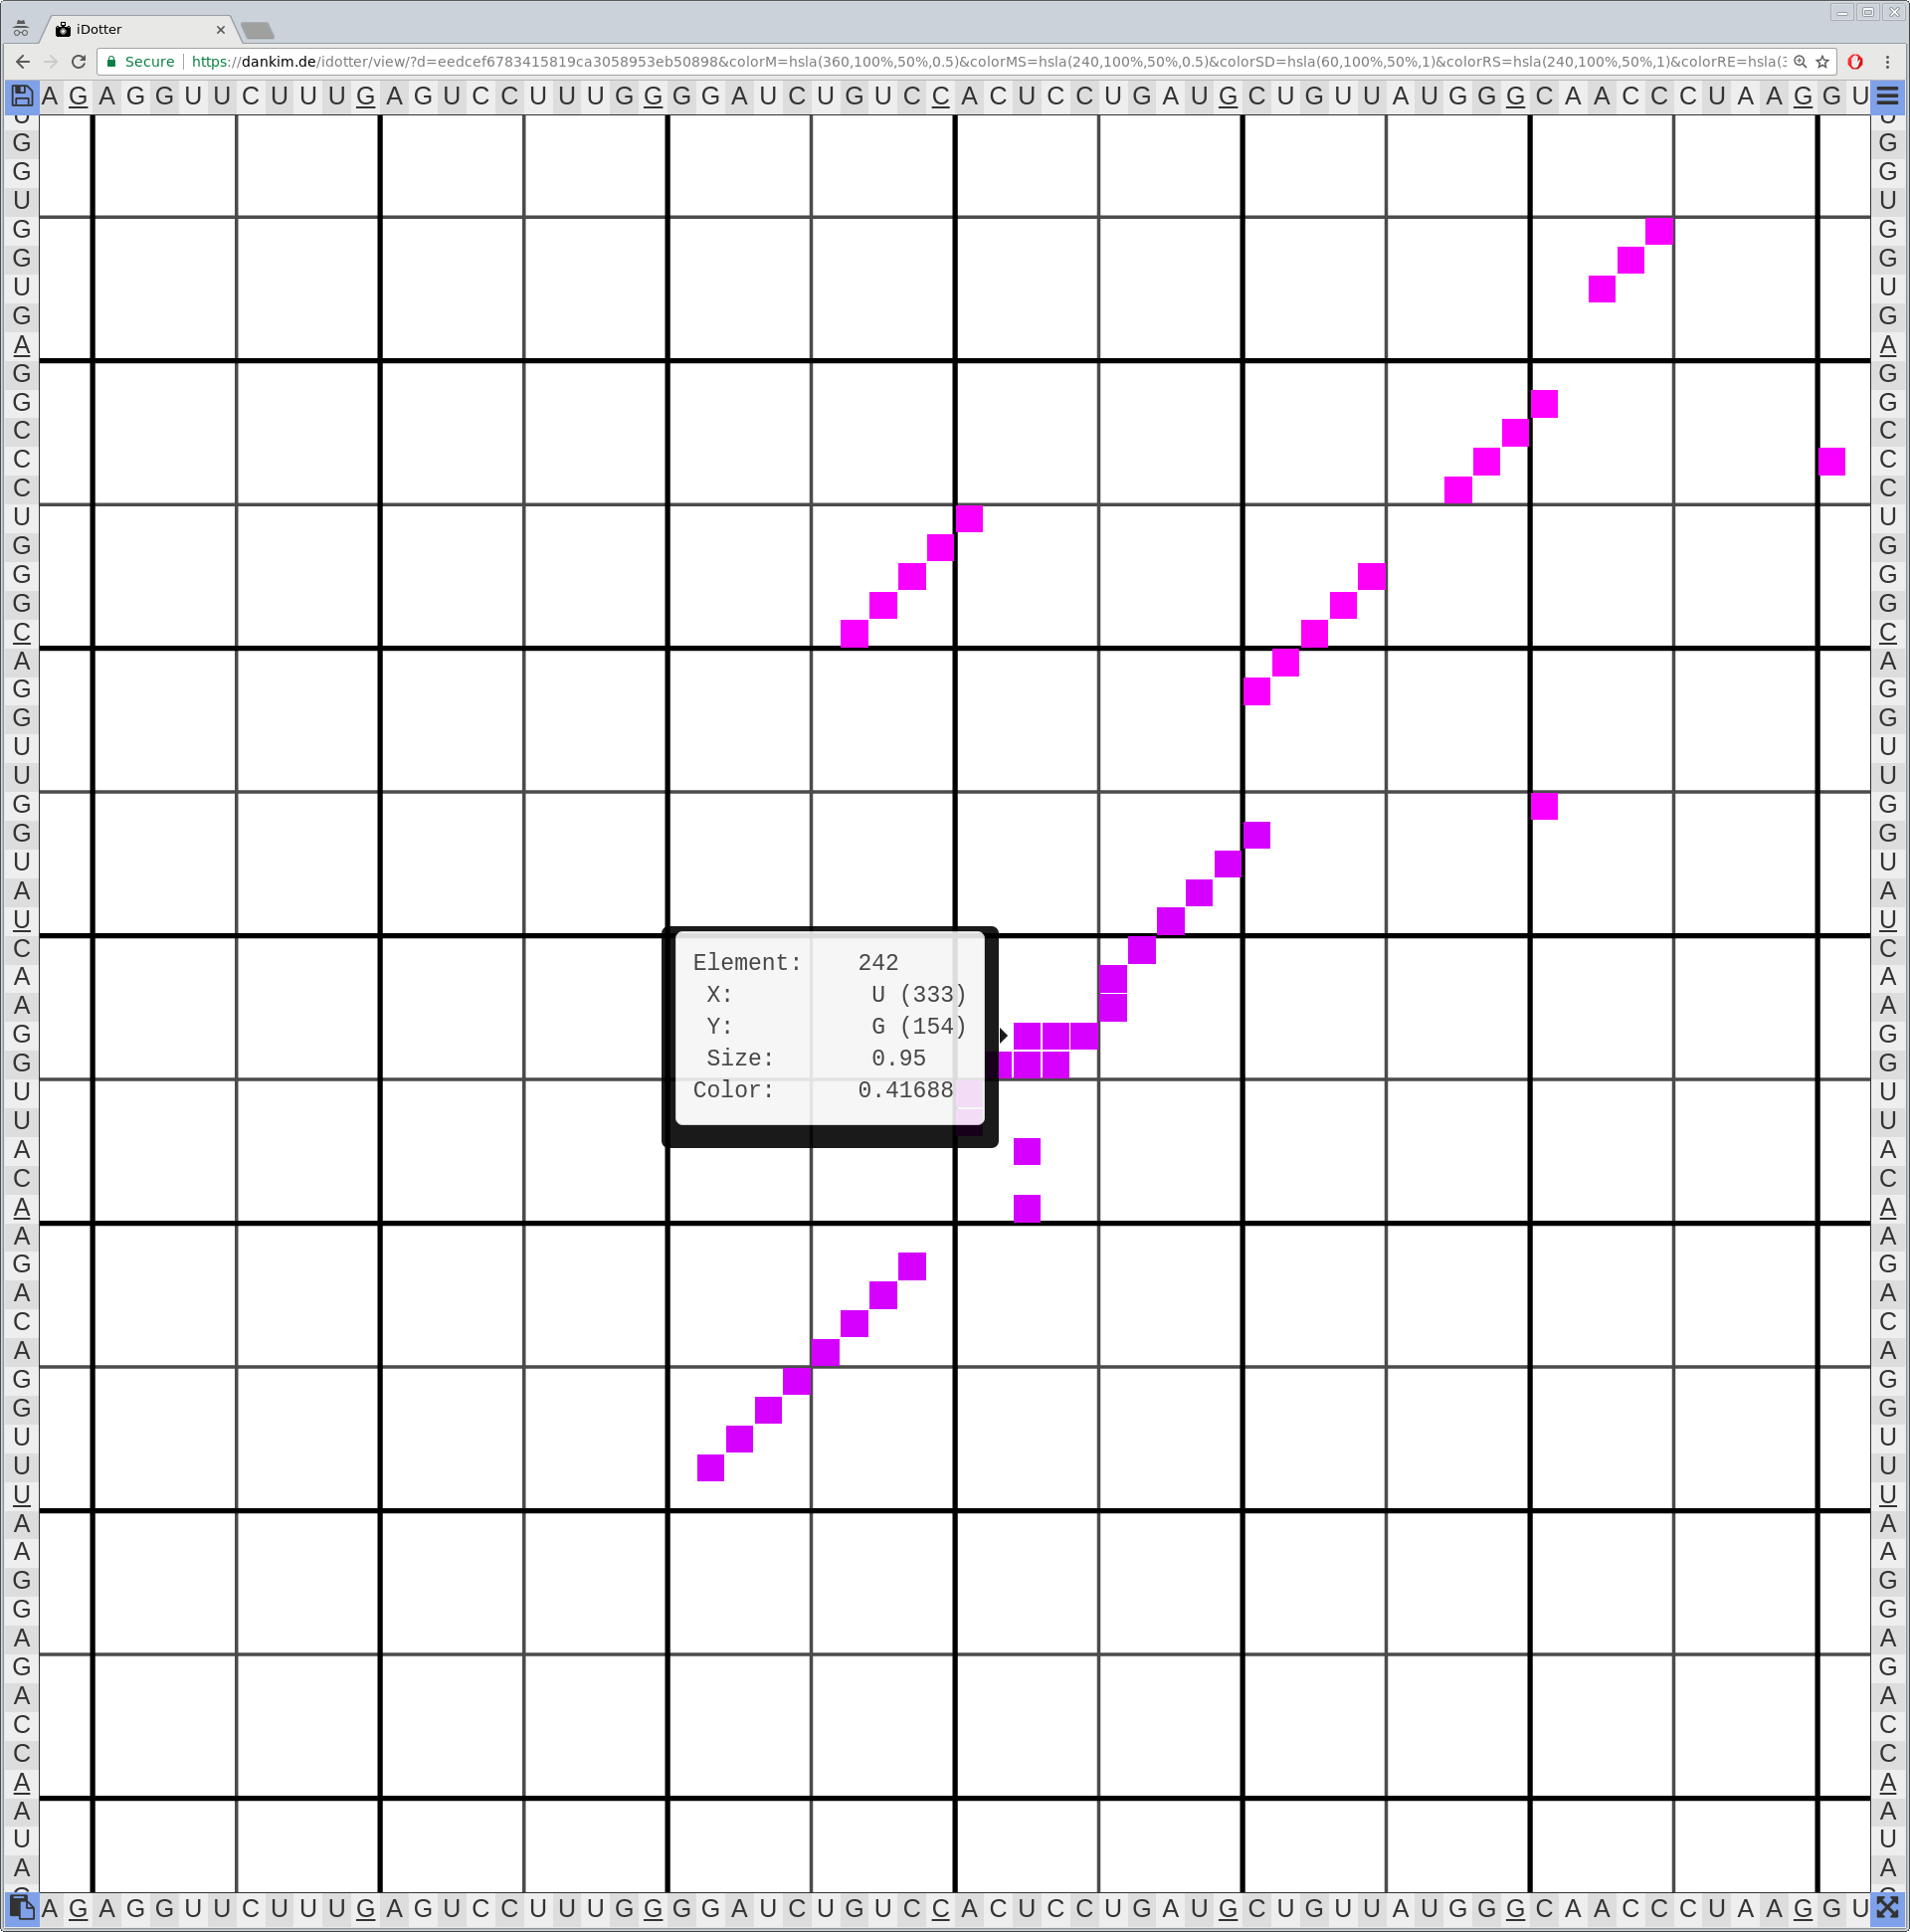
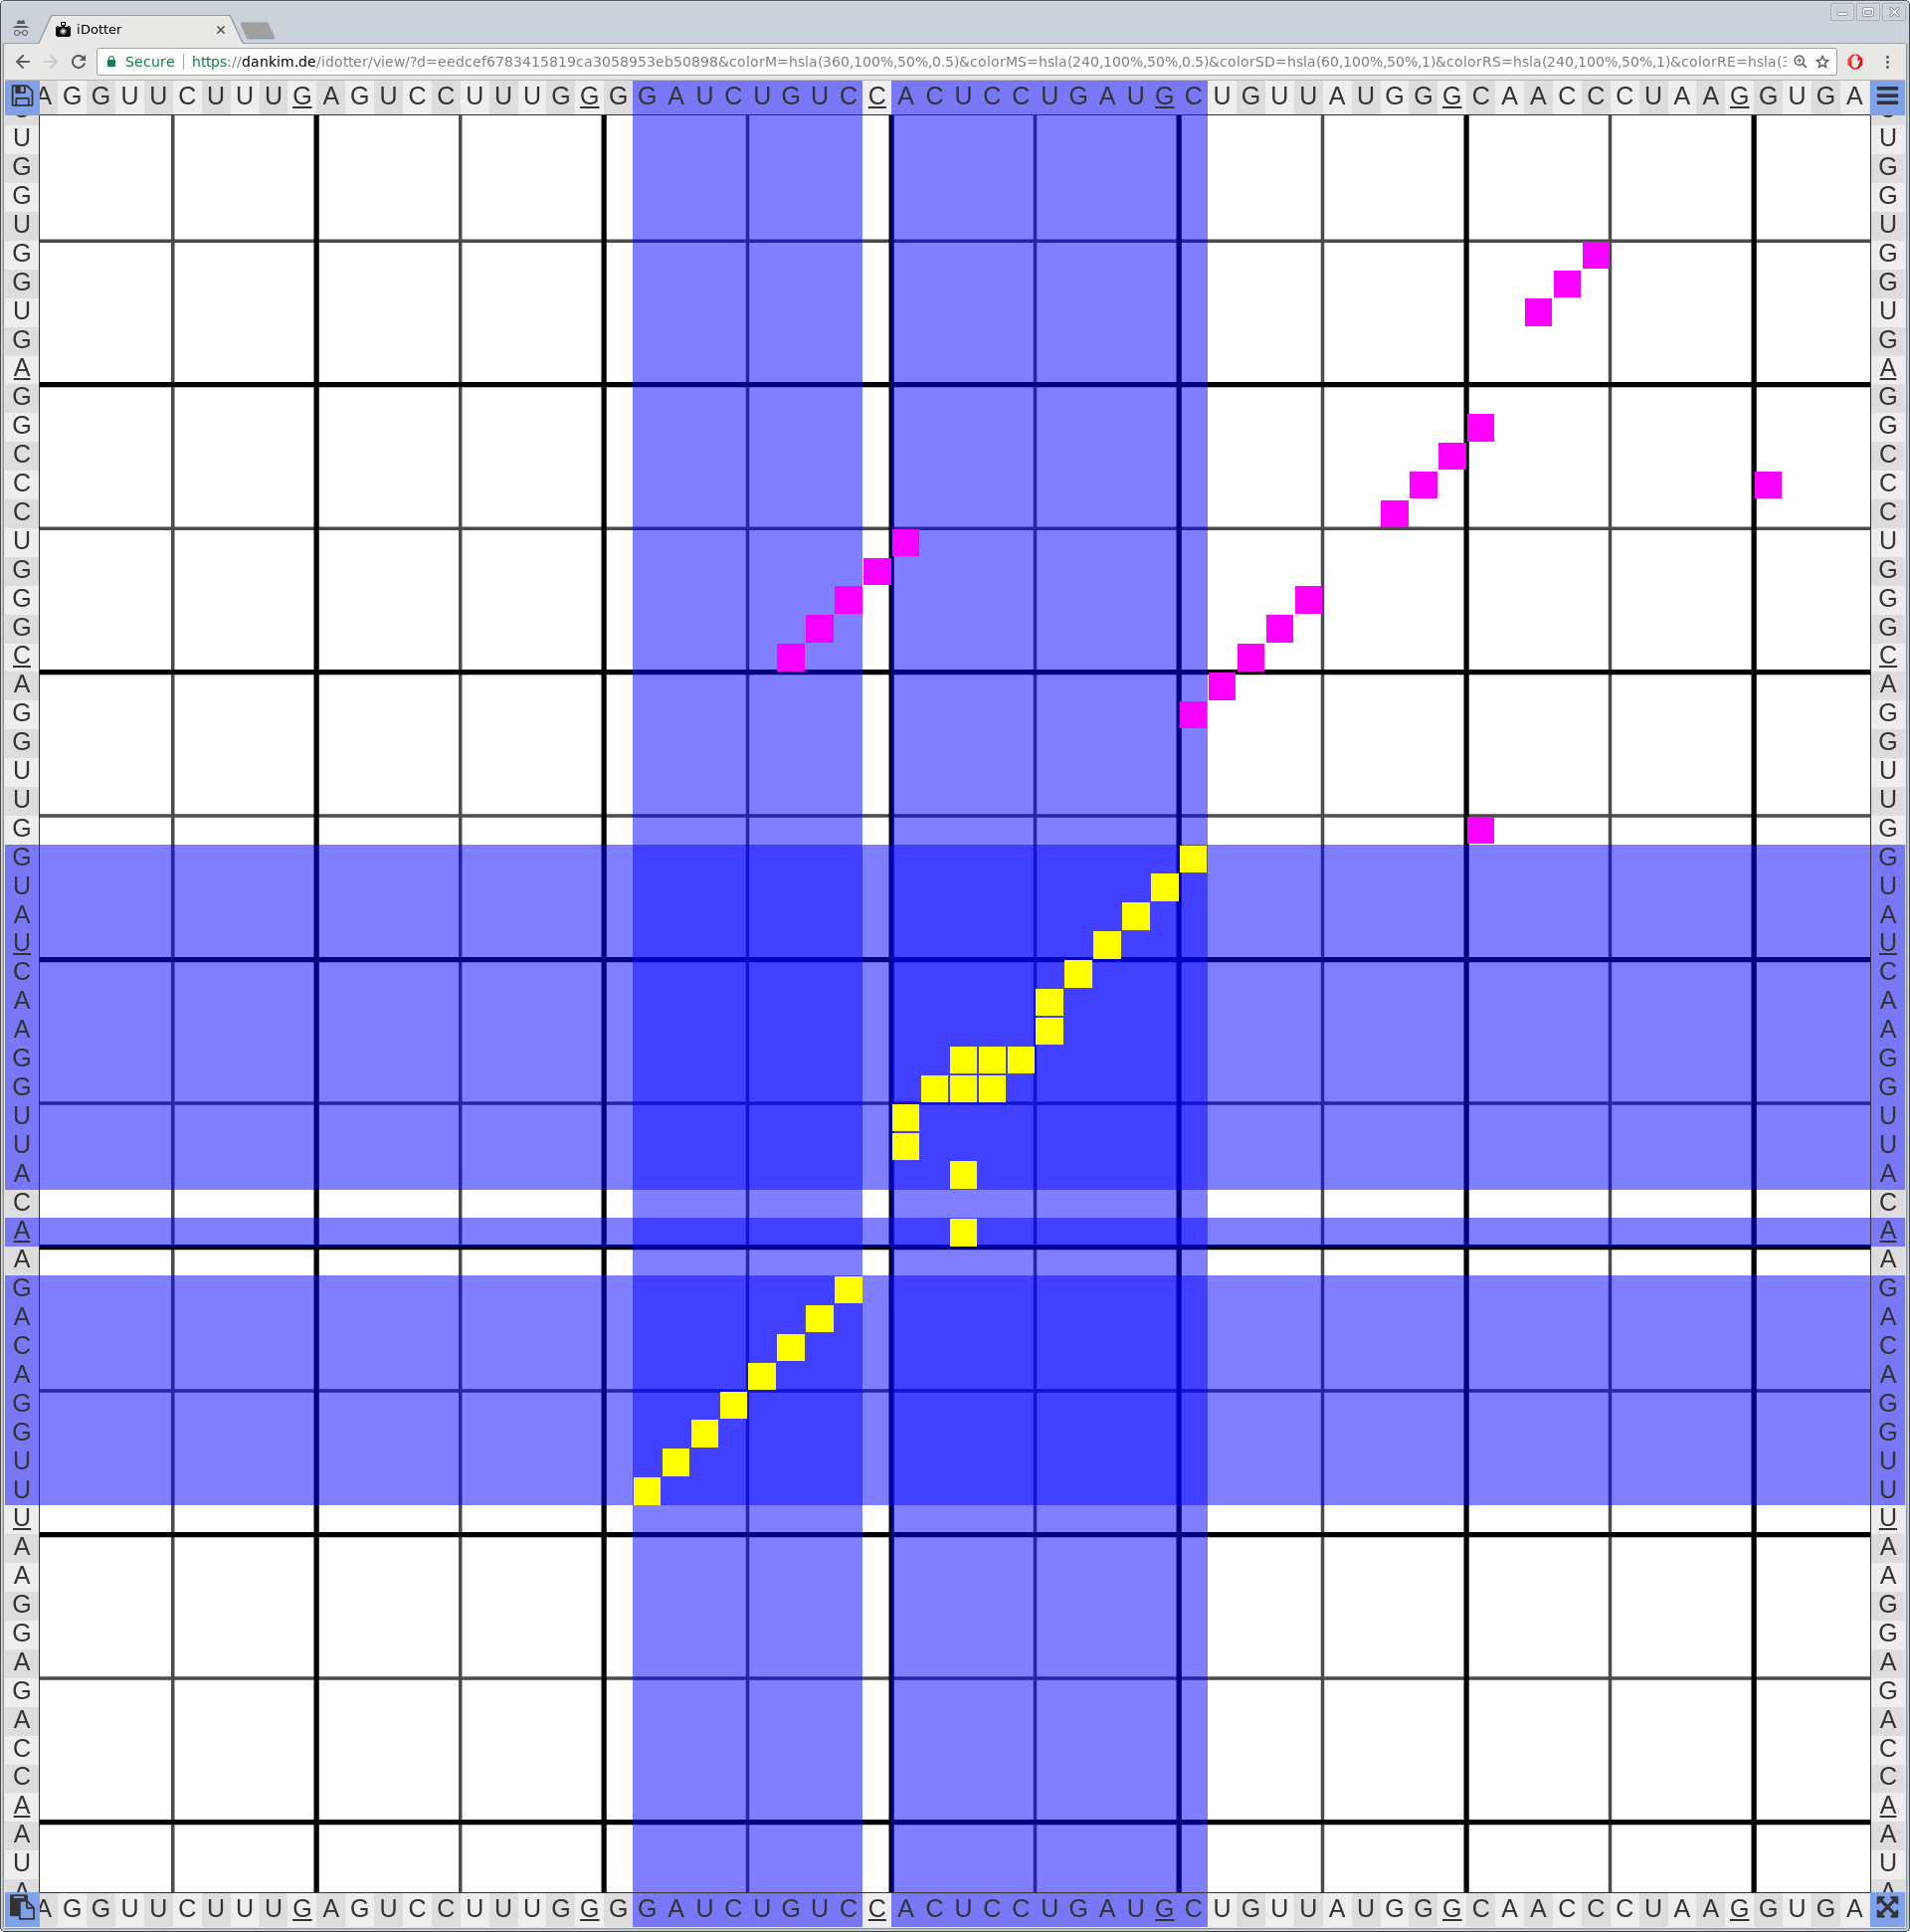
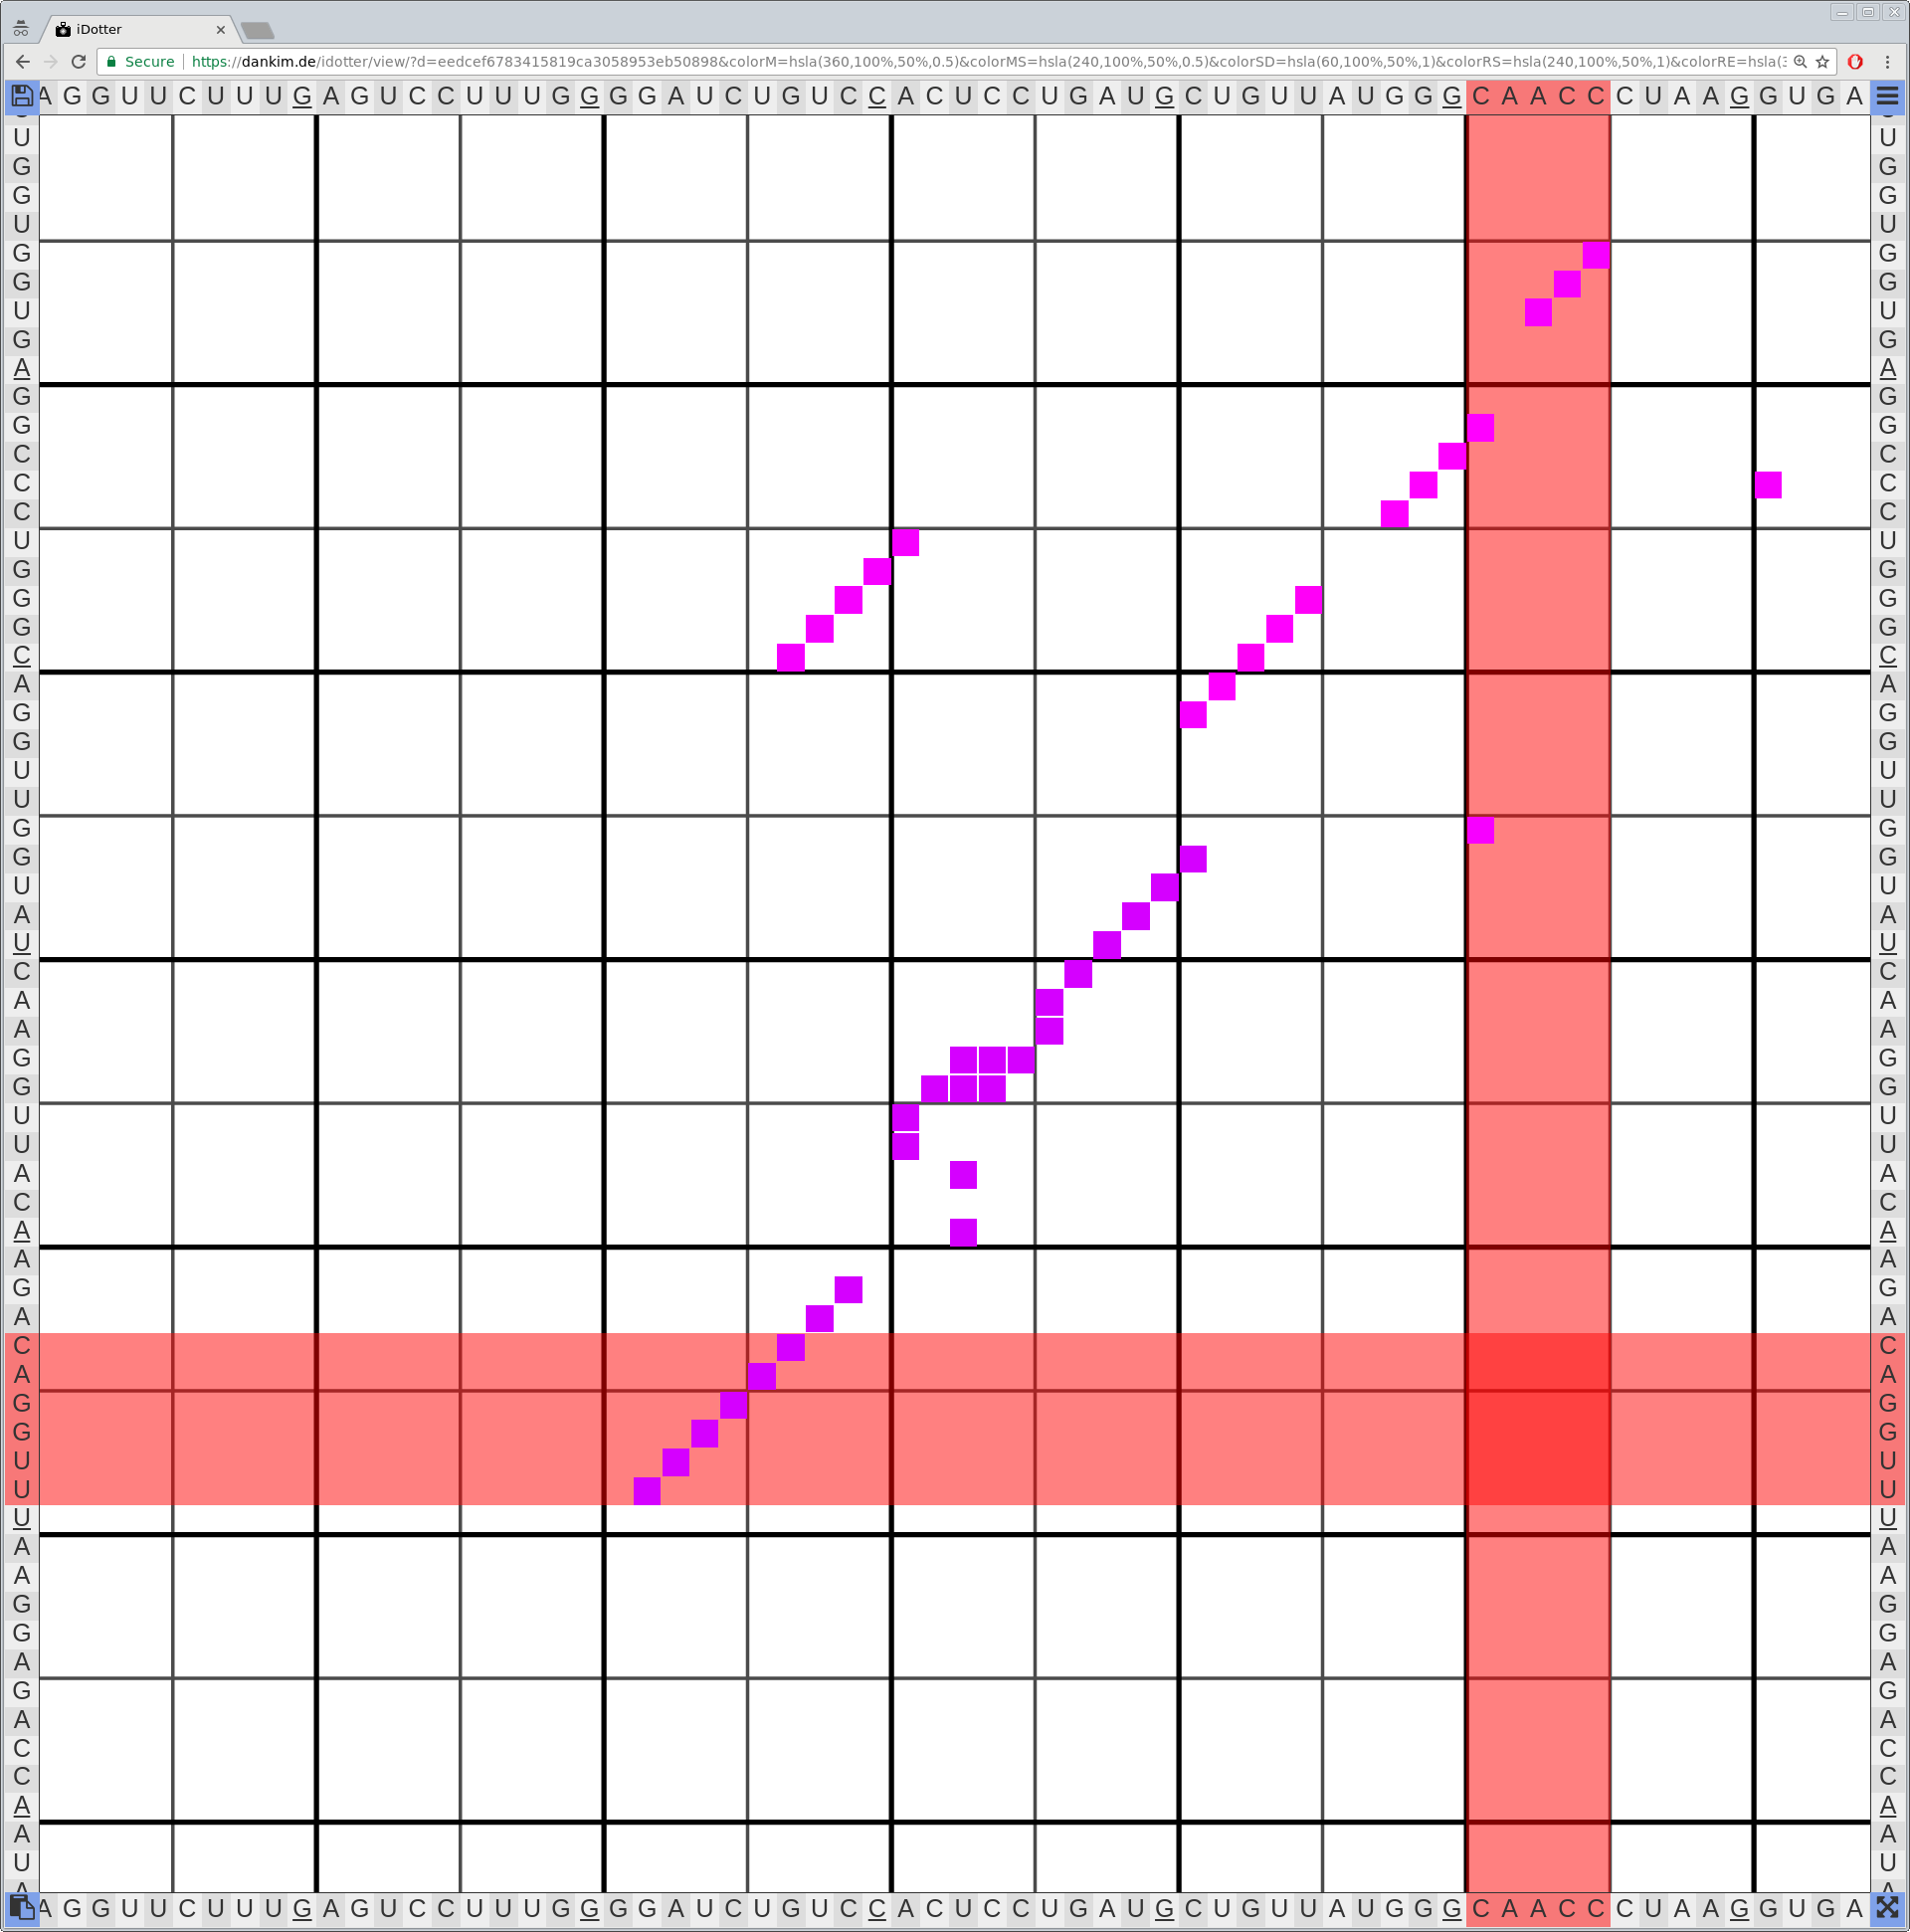
Bioinformaticians judge the likelihood of the overall RNA secondary structure based on comparing its base pair probabilities. These probabilities can be calculated by various tools and are frequently displayed using dot plots for further analysis. However, most tools produce only static dot plot images which restricts possible interactions to the capabilities of the respective viewers (mostly PostScript-viewers). Moreover, this approach does not scale well with larger RNAs since most PostScript viewers are not designed to show a huge number of elements and have only legacy support for PostScript. Therefore, we developed iDotter, an interactive tool for analyzing RNA secondary structures. iDotter overcomes the previously described limitations providing multiple interaction mech- anisms facilitating the interactive analysis of the displayed data. According to the biologists and bioinformaticians that regularly use out interactive dot plot viewer, iDotter is superior to all previous approaches with respect to facilitating dot plot based analysis of RNA secondary structures.
iDotter is available under the GNU GPL v3 on https://git.gurkware.de/biovis/idotter.git
iDotter is hosted at https://idotter.sca-ds.de


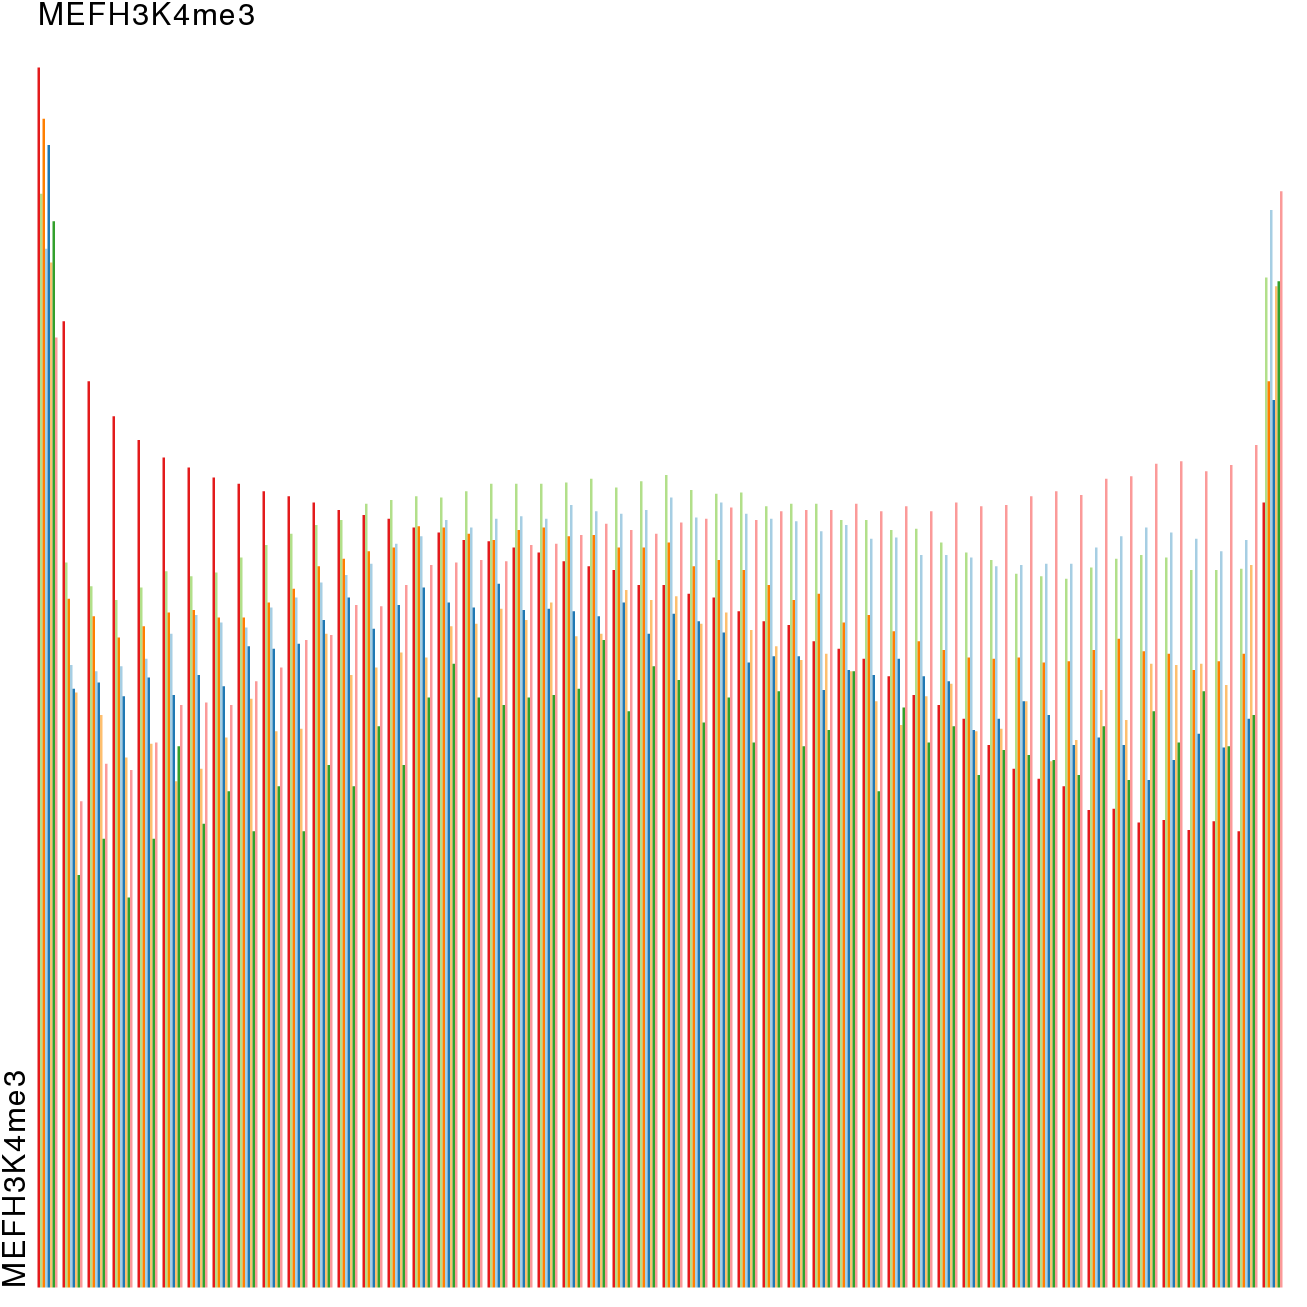
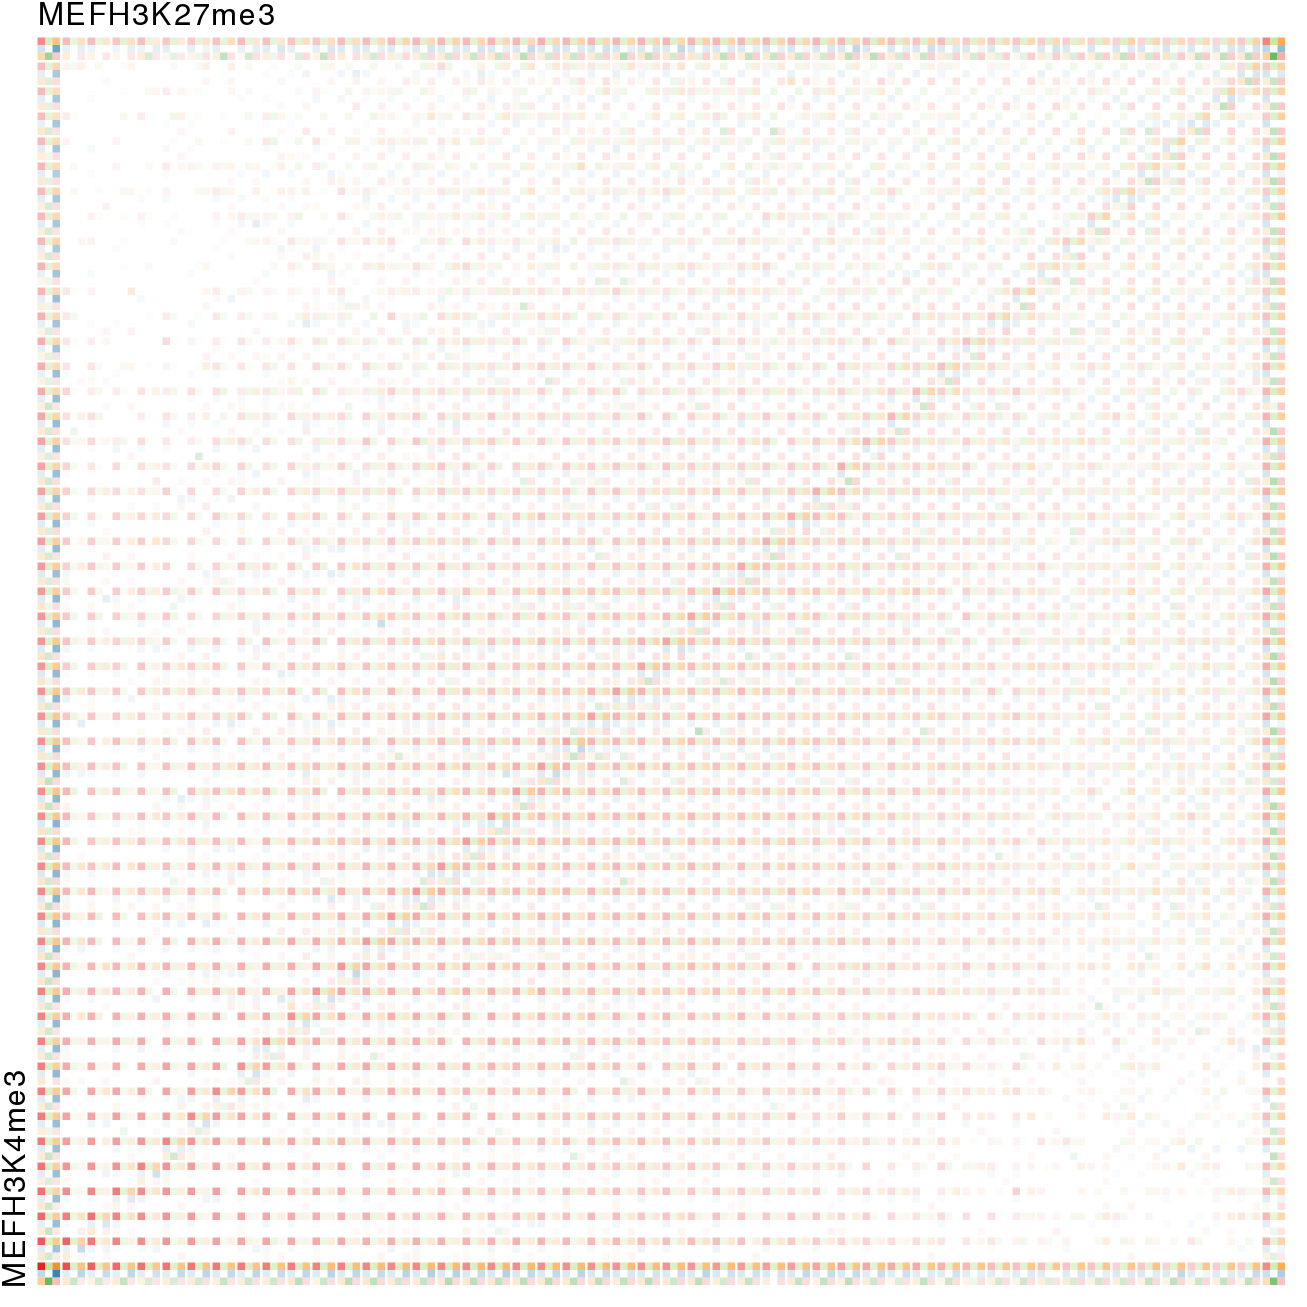
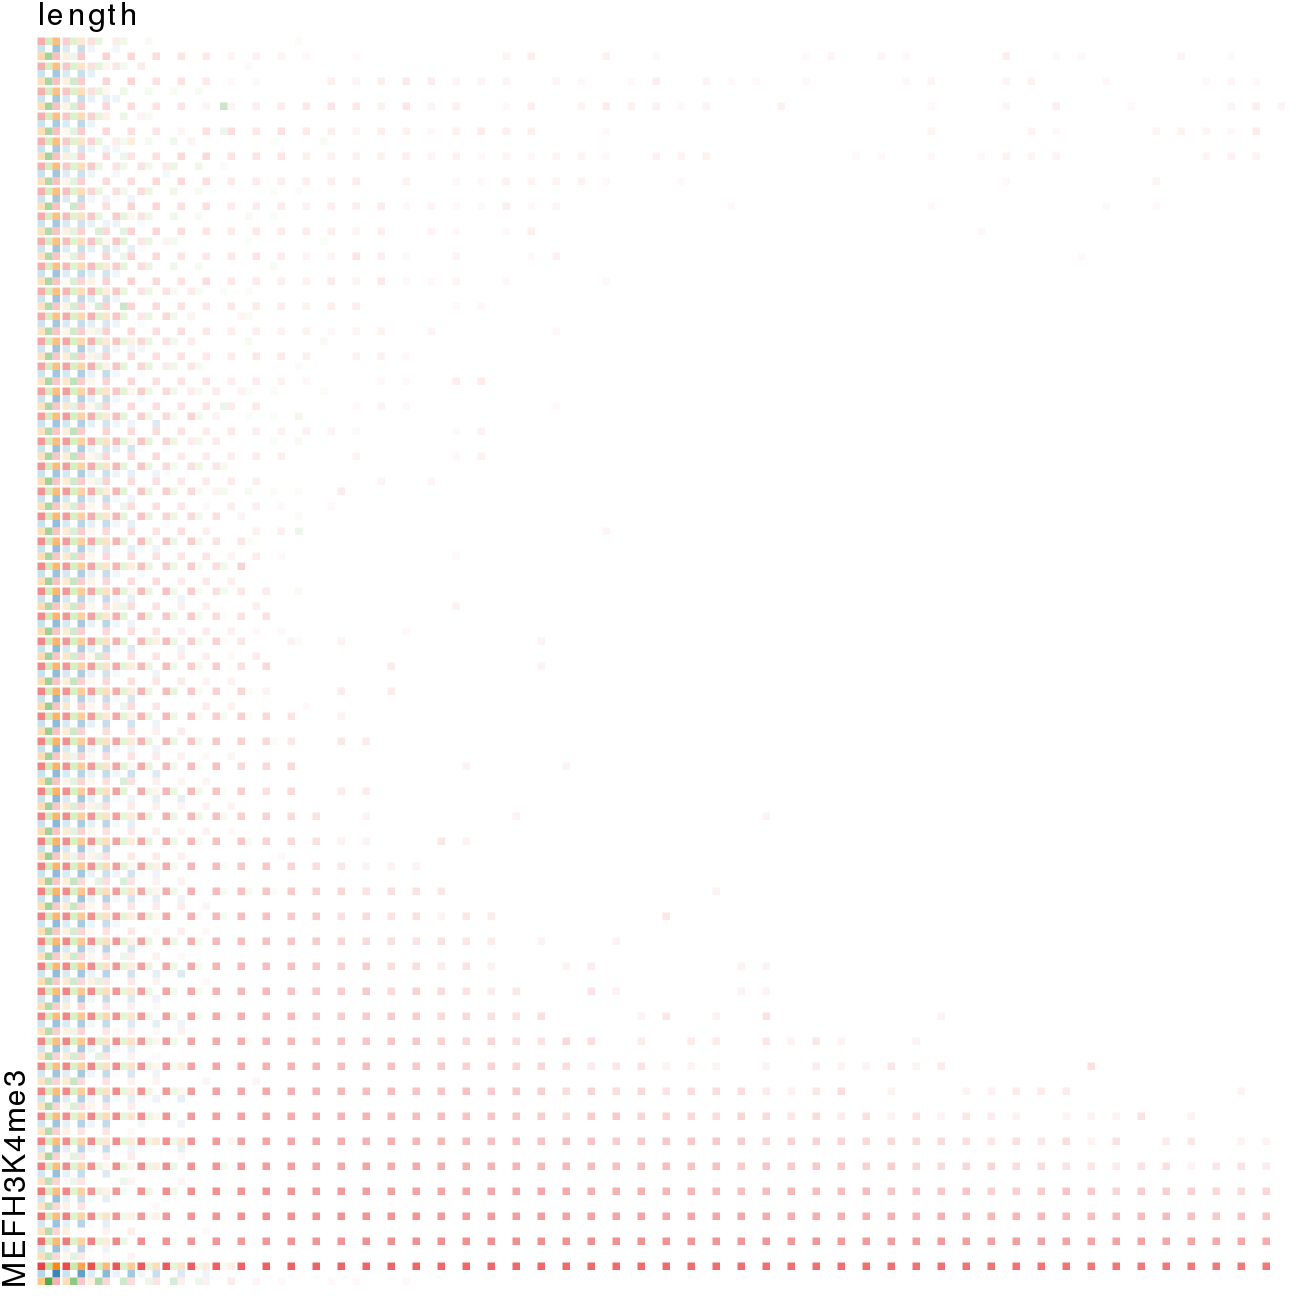
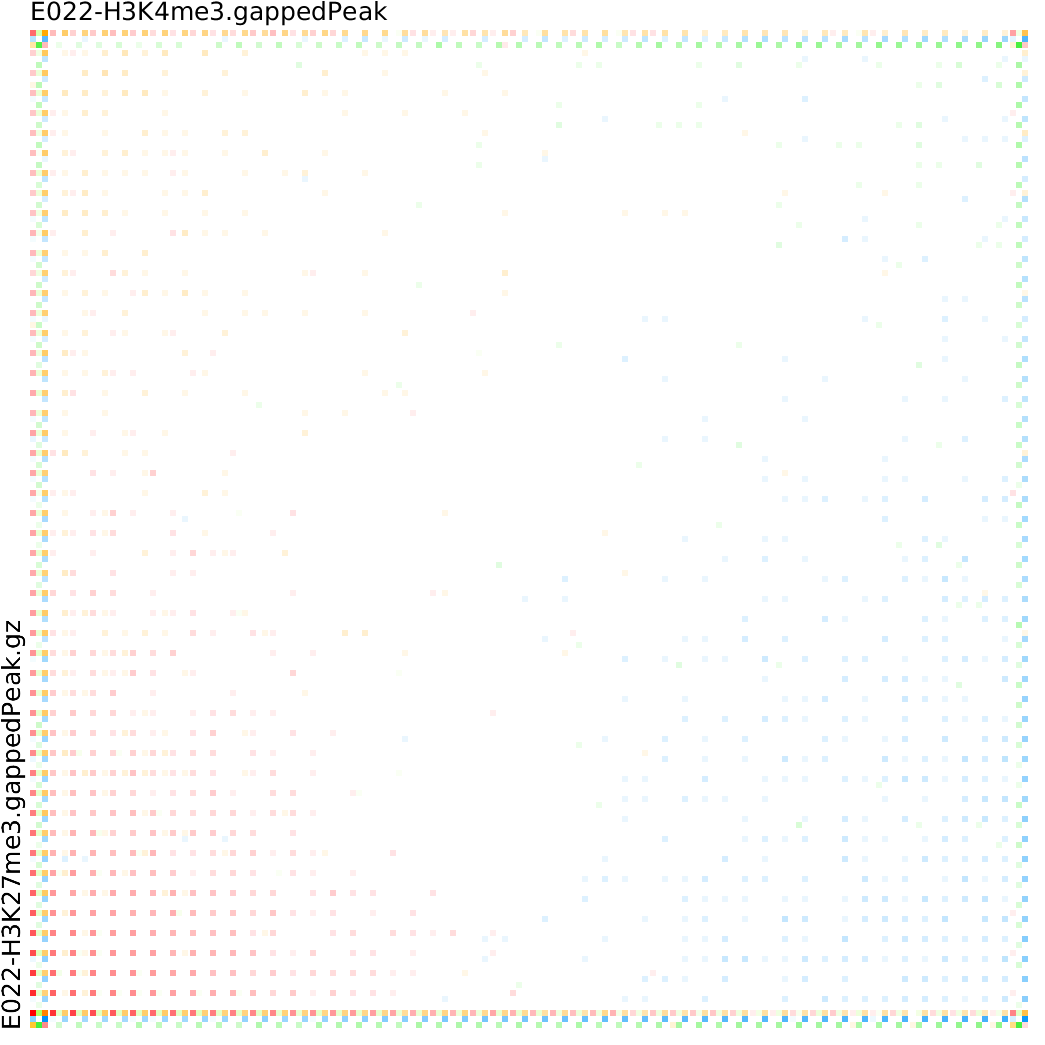
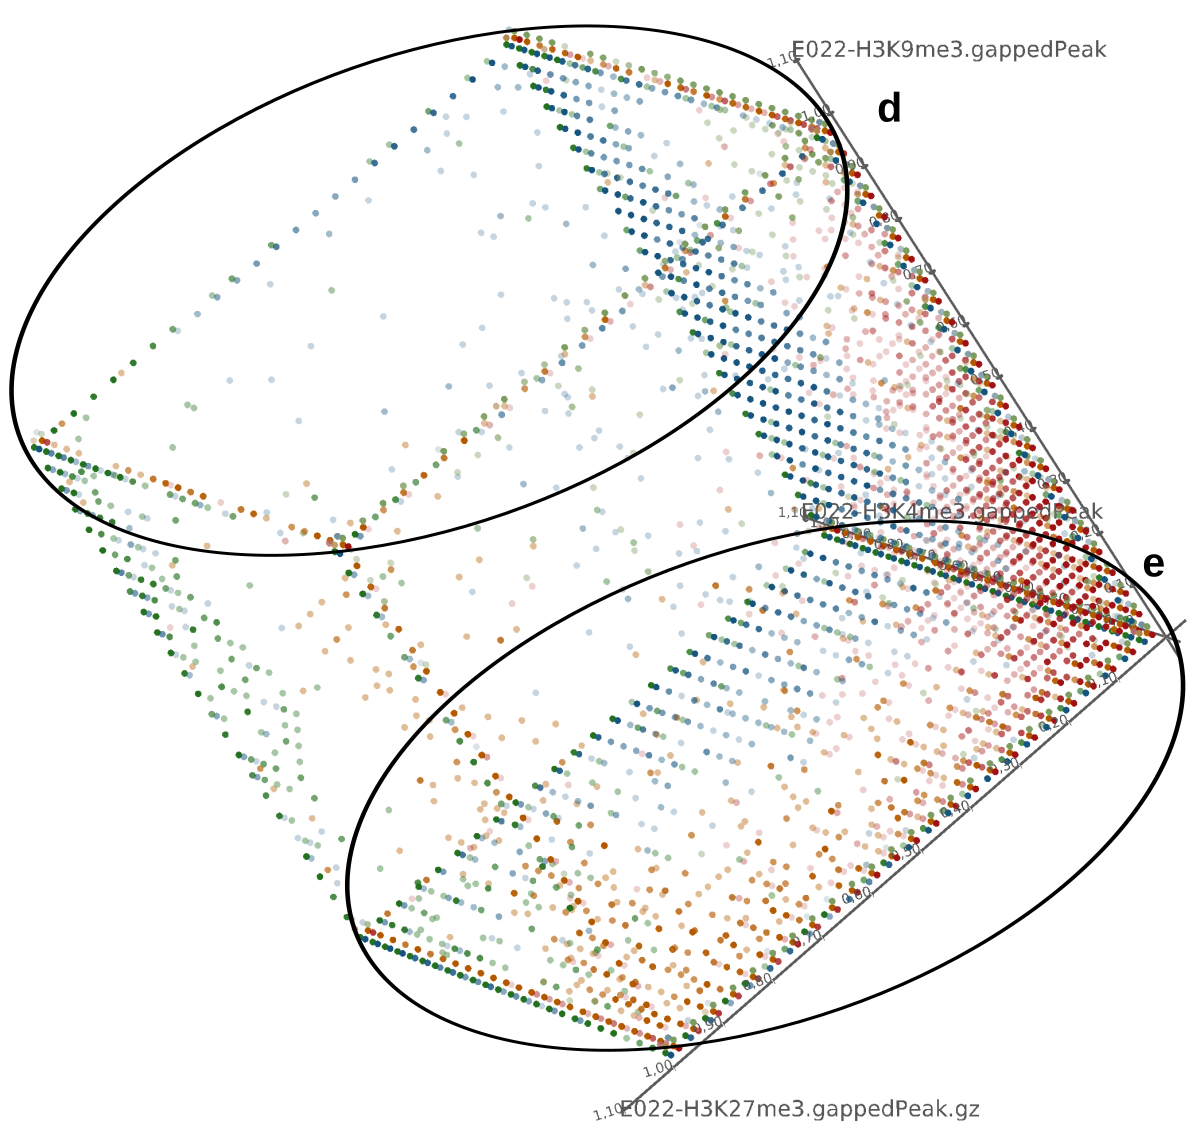
Epigenetics data is very important for understand- ing the differentiation of cells into different cell types. More- over, the amount of epigenetic data available was and still is considerably increasing. To cope with this big amount of data, statistical or visual analysis is used. Usually, biologists analyze epigenetic data using statistical methods like correlations on a high level. However, this does not allow to analyze the fate of histone modifications in detail during cell specification or to compare histone modifications in different cell lines. Tiled binned scatter plot matrices proved to be very useful for this type of analysis showing binary relationships. We adapted the idea of tiling and binning scatter plots from 2D to 3D, such that ternary relationships can be depicted. Comparing tiled binned 3D scatter plots—the new method—to tiled binned 2D scatter plot matrices showed, that many relations that are difficult or impossible to find using tiled binned 2D scatter plot matrices can easily be observed using the new approach. We found that using our approach, changes in the distribution of the marks over time (different cell types) or differences between different replicates of the same cell sample are easy to detect. Tiled binned 3D scatter plots proved superior compared to the previously used method due to the reduced amount of overplotting leading to less interaction necessary for gaining similar insights.
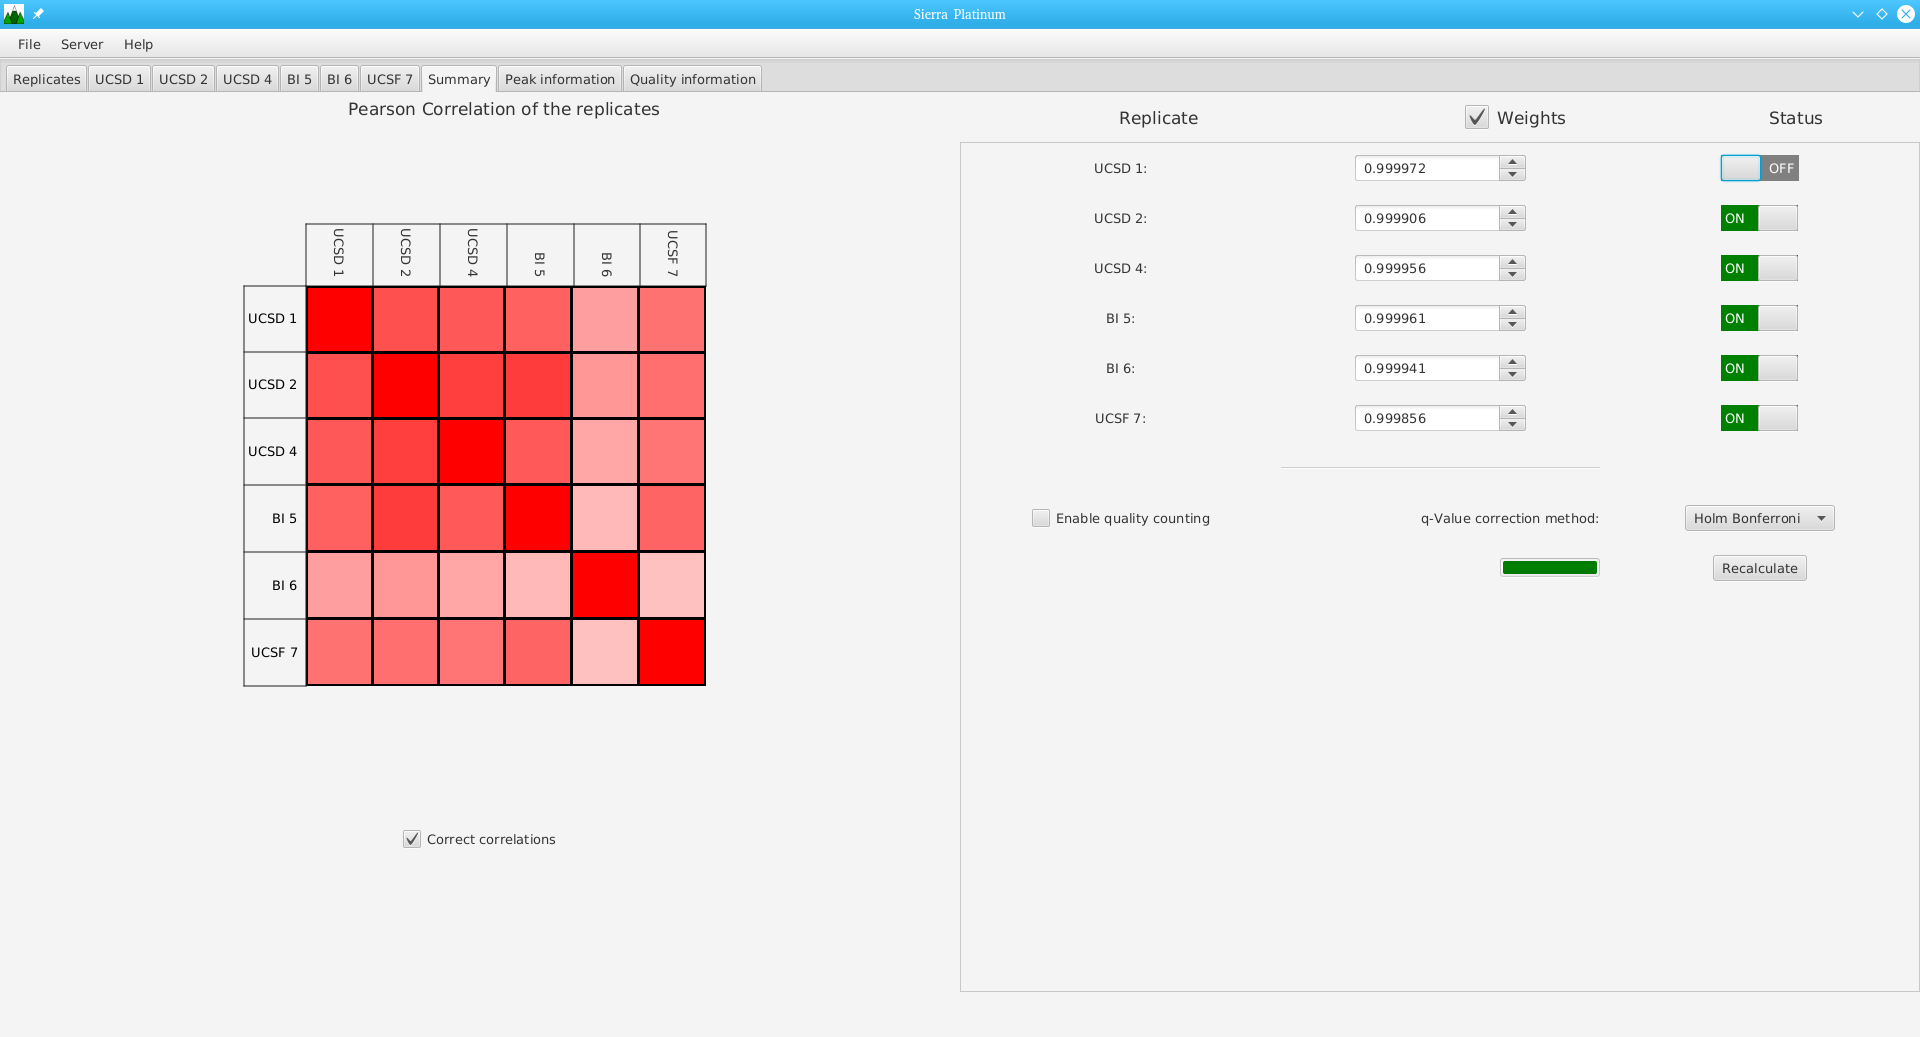
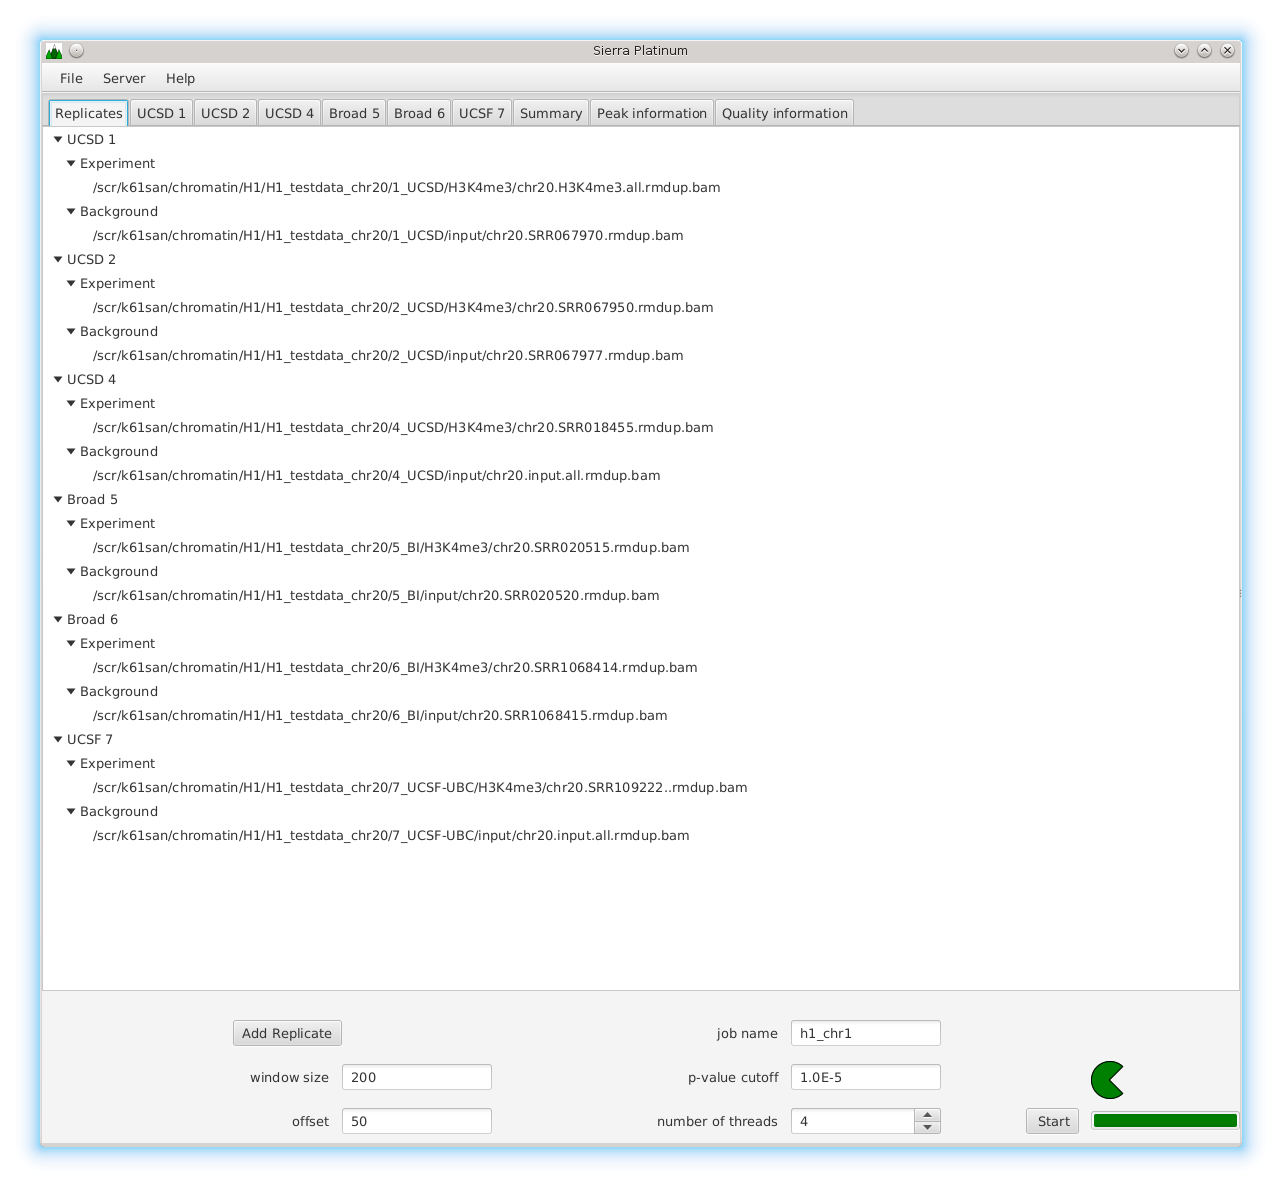
DNA bound proteins such as transcription factors and modified histone proteins play an important role in gene regulation. Therefore, their genomic locations are of great interest. Usually, the location is measured using ChIP-seq and analyzed using a peak-caller. While replicated ChIP-seq experiments become more and more available, they are still mostly analyzed using methods based on peak-callers for single replicates. The only exception is PePr, which allows peak calling of several replicates. However, PePr does not provide quality measures to assess the result of the peak-calling process. Moreover, its underlying model might not be suitable for the conditions under which the experiments are performed. We propose a new peak-caller called `Sierra Platinum' that not only allows to call peaks for several replicates but also provides a variety of quality measures. Together with integrated visualizations, the quality measures support the assessment of the replicates and the resulting peaks. We show that Sierra Platinum outperforms methods based on single-replicate peak-callers as well as PePr using a newly generated benchmark data set and using real data from the NIH Roadmap Epigenomics Project.

Over the last years, more and more biological data became available. Besides the pure amount of new data, also its dimensionality – the number of different attributes per data point – increased. Recently, especially the amount of data on chromatin and its modifications increased considerably. In the field of epigenetics, appropriate visualization tools designed for highlighting the different aspects of epigenetic data are currently not available. We present a tool called TiBi-Scatter enabling correlation analysis in 2D. This approach allows for analyzing multidimensional data while keeping the use of resources such as memory small. Thus, it is in particular applicable to large data sets.
TiBi-Scatter is a resource-friendly and easy to use tool that allows for the hypothesis-free analysis of large multidimensional biological data sets.
Published at the BioVis 2014